As the year turns, a common practice is to assess a portfolio and see how each position performed.
The summary for stocks is easy: equities did not do well
In short, 2018 was a rough year for investors. Even though I am a fan of “trusting the process“, I have to admit the last few months have not been fun.
But what about factor investing? How did these portfolios do in 2018? Unfortunately, similar to equity returns, most “factors” provided little relief in 2018 and many of them compounded the problem.
Let’s dig into the details.
Factor Data and Details
To set up the tests, I examine the holdings of the IWB ETF (~1,000 largest U.S. stocks). (1)
The holdings are updated on quarter end dates (e.g., 12/31/17, 3/31/18, 6/30/18, and 9/30/18), with the factors being calculated on the same dates. Once the holdings and factors are calculated, the holdings are then split into decile portfolios and held for 3 months.(2) All portfolios, including the Universe and the Factor Deciles, are equal weighted.
Within the portfolios, I examine a variety of common factors:
Factors
- Value Factors (5):
- Enterprise Multiple (EBIT/TEV)
- Book-to-Market (B/M)
- Earning’s Yield (Inverse of P/E)
- Cash-Flow to Price (CF/P)
- Sales to Price (S/P)
- Momentum (12_2)(3)
- Size
- Beta
- Quality — Return on Assets (ROA)
For all variables except Size and Beta, a higher value is considered “better” and thus the firms would be in higher deciles.
The Factor Results
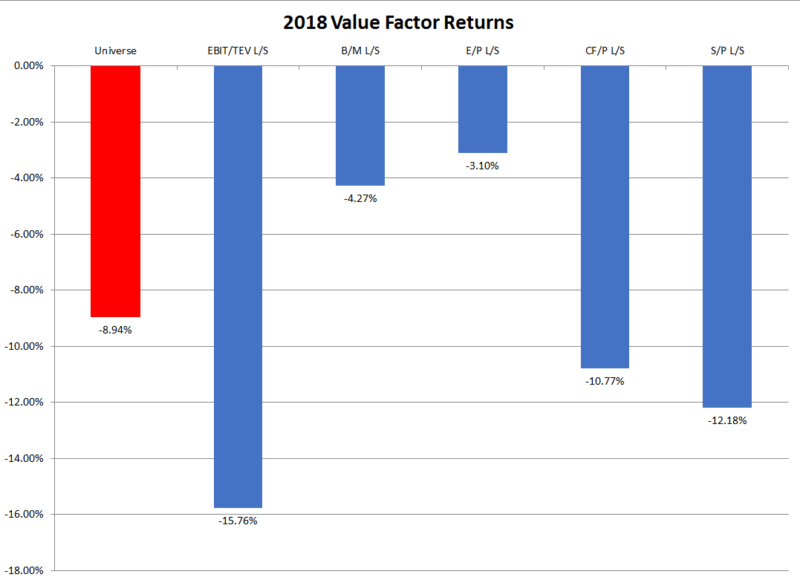
First, let’s examine the results to the overall Universe as well as the five “Value” factors I described above. Below are the annualized returns to the Universe of stocks examined, as well as the long/short portfolios for the five respective Value factors.
The results are hypothetical results and are NOT an indicator of future results and do NOT represent returns that any investor actually attained. Indexes are unmanaged and do not reflect management or trading fees, and one cannot invest directly in an index. Data Source: FactSet
On the far left-hand column, one can see the returns to the Universe.(4)The annual returns to the Universe highlight what many U.S. equity investors realized in 2018–negative returns. In this case, the equal-weight
The next five blue bars represent the returns to the Long/Short portfolios for the five value measures listed above: EBIT/TEV, Book-to-Market (B/M), Inverse P/E (E/P), Cash-Flow-to-Price (CF/P), and Sales-to-Price (S/P)
What one immediately notices is that the returns are all negative. So while we can argue over which value metric is the best, in 2018 they all did poorly and EBIT/TEV lead the way as the worst value metric.
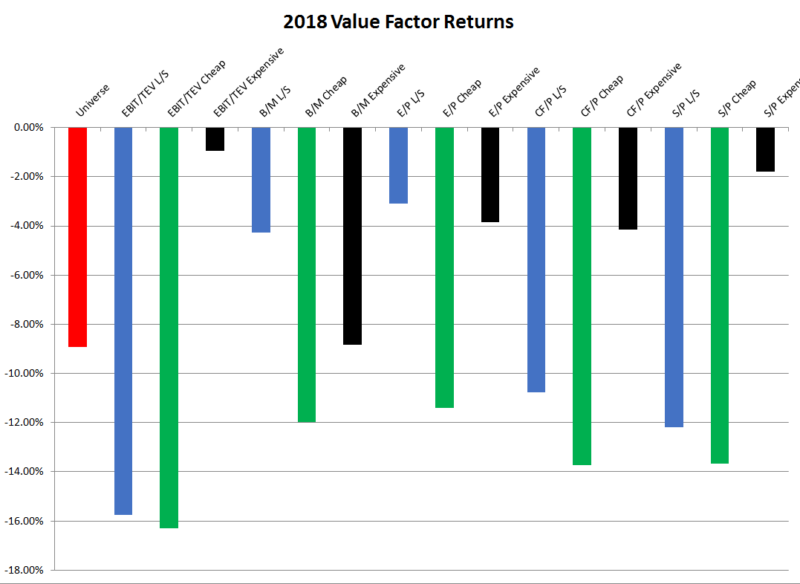
To further drive home this point, below I show the returns to long-only value portfolios, as well as the “expensive” portfolios on each measure. This can be helpful to better understand 2018 returns to factor portfolios since most “factor” investors actually only invest in long-only portfolios.
The results are hypothetical results and are NOT an indicator of future results and do NOT represent returns that any investor actually attained. Indexes are unmanaged and do not reflect management or trading fees, and one cannot invest directly in an index. Data Source: FactSet
The far-left bar (red) still represents the Universe returns, while the blue bars still represent the L/S returns. For each factor, I also plotted the “cheap” or “good” portfolio (green) and the “expensive” or “bad” portfolio (black).
So much for value investing — “cheap” portfolio lost to the “expensive” portfolio on every measure. In addition, every cheap portfolio lost to the Universe!(5) In addition, every “expensive” portfolio beat the Universe!
So overall, within the U.S., Value had a bad year no matter how one picked their cheap stocks.
But what about the other factors mentioned above? How did they perform?
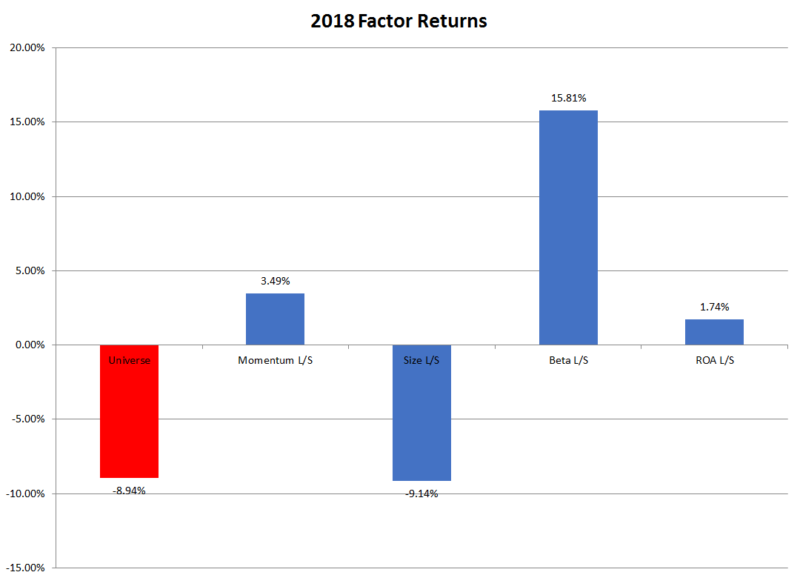
Below I run a similar analysis on the remaining 4 factors: Momentum, Size, Beta, and Quality (ROA).
The results are hypothetical results and are NOT an indicator of future results and do NOT represent returns that any investor actually attained. Indexes are unmanaged and do not reflect management or trading fees, and one cannot invest directly in an index. Data Source: FactSet
One immediately notices that three of the four long/short factors — Momentum, Beta and ROA (a proxy for Quality) — had positive years last year.(6) Size
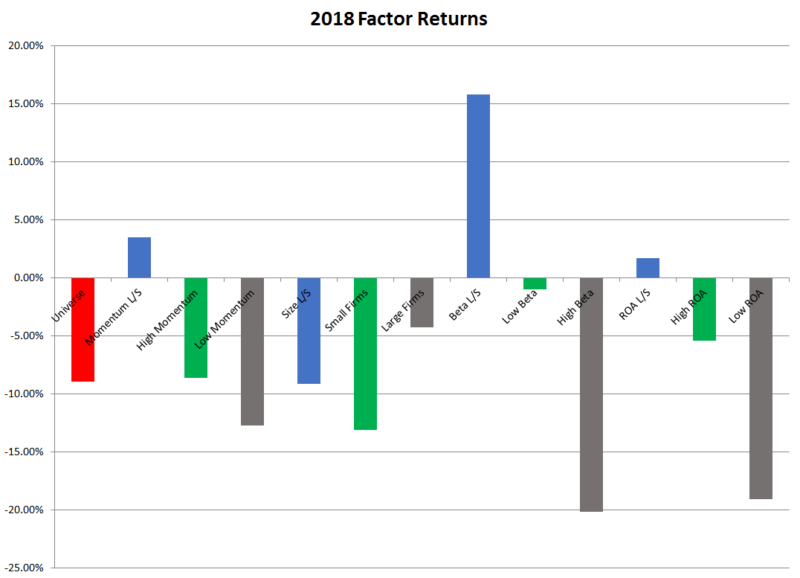
However, since most investors are invested in long-only funds, let’s examine the returns to the “good” and “bad” portfolios, in other words, the “long” and the “short” portfolios. I graph this below, with the good portfolios in green and the bad portfolios in grey.
The results are hypothetical results and are NOT an indicator of future results and do NOT represent returns that any investor actually attained. Indexes are unmanaged and do not reflect management or trading fees, and one cannot invest directly in an index. Data Source: FactSet
Examining the factors with the positive L/S returns (blue), we notice that the “long” portfolios (green) all had negative returns in 2018. For example, the good portfolios of stocks that have (1) high momentum, (2) low beta, and (3) high ROA, all had negative years. So while the long/short portfolio was positive, this was due to the fact that the long outperformed the short, or “bad” portfolio. Not to be forgotten, we also notice that the size effect was definitely negative in 2018, with larger firms outperforming smaller firms.
Conclusion
In 2018, all Value measures failed and Size was another bad bet. Even within the Factors that “worked” (i.e., had positive long/short returns), the returns to their corresponding “good” factor portfolios had negative returns in 2018.(7) In fact, every long-only portfolio examined above was negative in 2018.
It should be caveated that this is only examining stocks that were, at one point in time, within the IWB ETF (~1,000 largest firms). In addition, managers and funds generally (1) hold more or fewer stocks, (2) use different weighting schemes, (3) use different rebalance dates, (4) combine or use multiple signals, and (5) may invest in stocks outside of this universe. Thus, this cannot fully explain all the returns to factor portfolios, but it is a start.
So what should a factor investor do after a year like 2018? First off, it is always good to understand “why” one may be investing in a factor fund. Second off, within factor investing there is a wide variety of options, from very concentrated portfolios to portfolios that are very similar to a market-cap index fund. Our Visual Active Share tool can help with this assessment. Last, if you don’t fully understand something, ask questions! We, or others in the industry, would be happy to help answer questions you may have.
Have a great 2019!

References[+]
| ↑1 | The idea is to examine what many would claim to be “investable” universes. Of course, one can invest in other stocks outside the universe, but examining the top ~1,000 stocks is generally instructive for most factor portfolios. |
|---|---|
| ↑2 | All data and calculations are done by FactSet. |
| ↑3 | The twelve-month momentum excluding the prior month |
| ↑4 | Once again, the portfolio returns, as well as the Universe, returns, employ an equal-weighted technique. |
| ↑5 | This is akin to the “market” in this context. |
| ↑6 | When examining the long/short portfolio |
| ↑7 | Note, this is how most factor investors actually invest. |
About the Author: Jack Vogel, PhD
—
Important Disclosures
For informational and educational purposes only and should not be construed as specific investment, accounting, legal, or tax advice. Certain information is deemed to be reliable, but its accuracy and completeness cannot be guaranteed. Third party information may become outdated or otherwise superseded without notice. Neither the Securities and Exchange Commission (SEC) nor any other federal or state agency has approved, determined the accuracy, or confirmed the adequacy of this article.
The views and opinions expressed herein are those of the author and do not necessarily reflect the views of Alpha Architect, its affiliates or its employees. Our full disclosures are available here. Definitions of common statistics used in our analysis are available here (towards the bottom).
Join thousands of other readers and subscribe to our blog.