In a recent ETF column, Allan Roth listed five investment lessons. While I agreed with much of what he wrote, one claim—factor investing has “failed miserably”— called for examination of the facts. But first, a little background.
William Sharpe, Jack Treynor and John Linter are typically given most of the credit for introducing the capital asset pricing model (CAPM). The CAPM was the first formal asset pricing model. It provided the first precise definition of risk and how it drives expected returns.
The CAPM looks at returns through a “one-factor” lens, meaning the risk and return of a portfolio is determined only by its exposure to market beta. In the 1993 publication of the study “Common Risk Factors in the Returns on Stocks and Bonds,” Eugene Fama and Kenneth French proposed a new asset pricing model, which became known as the Fama-French three-factor model. This model proposes that, in addition to the market beta factor, exposure to the factors of size and value further explain the cross-section of expected stock returns. The authors demonstrated that we lived not in a one-factor world, but in a three-factor world. They showed how the risk and expected return of a portfolio is explained by not only its exposure to market beta but also its exposure to the size (small stocks) and price (stocks with low prices relative to book value, or value stocks) factors. Fama and French hypothesized that while small-cap and value stocks have higher market betas—more equity-type risk—they also contain additional, unique risks (they are not free lunches) unrelated to market beta. The Fama-French three-factor model improved the explanatory power from about two-thirds of the differences in returns between diversified portfolios to more than 90 percent.
The Fama-French model became the workhorse model for financial economists. The fund family Dimensional Fund Advisors (Fama and French led their research efforts) led the way in introducing factor-based funds based on the Fama-French research. (Full disclosure: My firm, Buckingham Strategic Wealth, recommends Dimensional funds in constructing client portfolios.)
Today, while hundreds of factors have been identified in the literature, only a few are generally accepted as adding incremental explanatory power. And while there is some competition as to which is the best model, the most accepted four- and five-factor models include some combination of market beta, size, value, momentum, profitability and investment.
To test the claim that “Small-cap value and many other factors failed miserably,” we’ll examine the live returns of the factor-based funds with the longest track record, those of Dimensional, and compare their returns with those of the market-like portfolios of the premier provider of index-based strategies, Vanguard. We’ll look at data for the longest period that both the factor-based fund of Dimensional and the total market fund of Vanguard has been available. Using live funds allows us to account for both fund expenses and trading costs. Data is from Portfolio Visualizer.
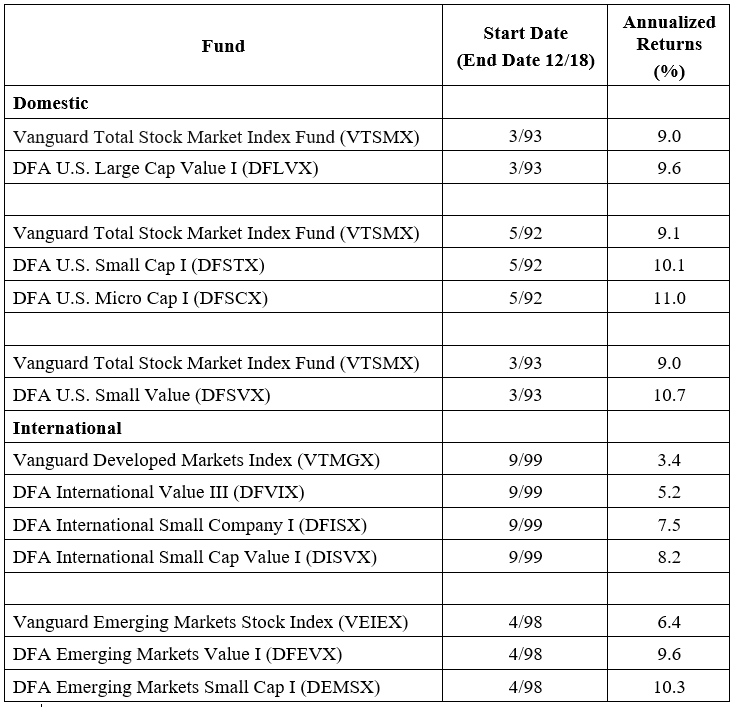
In each of the nine cases, the factor-based fund run by Dimensional outperformed the Vanguard total market fund, with the outperformance ranging from 0.6 percentage point to as much as 4.8 percentage points. Despite the higher fund expenses, both in terms of expense ratios and trading costs (due to higher turnover and trading in less liquid small stocks), the nine Dimensional funds produced an average outperformance of 2.6 percentage points.
Not only has factor investing, done properly, not failed miserably (as claimed), but investors have been well rewarded for their beliefs.
So where does this idea of failure come from? One reason we hear the claim is because of the behavioral problem known as “recency bias”—focusing on short-term performance while ignoring long-term historical evidence.
Recency Bias
It’s certainly true that over the most recent 10-year period, the value premium in the U.S. has basically disappeared (at least when value is proxied via portfolios of high book-to-market stocks). That’s one reason we hear the claims of “value is dead” and “factor investing has failed.” Another explanation we hear is that “cash flows into the strategy have eliminated the premium.” We’ll examine each of these claims to see if they hold up. To begin, we’ll examine the 10 calendar years for both U.S. and international value funds. We’ll also look at the returns to small stocks. Data is again from Portfolio Visualizer.
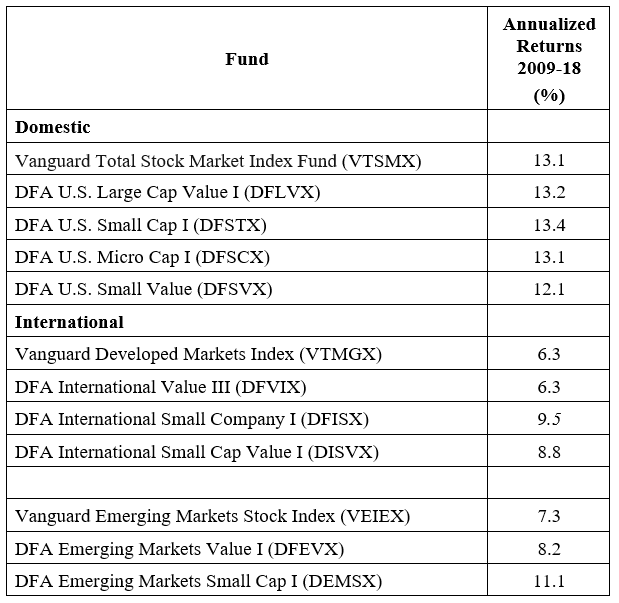
While it’s true that U.S. small value stocks underperformed, with DFSVX underperforming VTSMX by 1 percentage point, DFLVX actually outperformed by 0.1 percentage point. And if the value premium were, in fact, dead, how do you explain the fact that, while DFVIX matched the performance of VTMGX, DISVX outperformed by 2.5 percentage points and DFEVX outperformed by 0.9 percentage point? As to the size premium, while there was virtually no realizable size premium in the U.S. over the period, DFISX outperformed VTMGX by 3.2 percentage points a year, and DEMSX outperformed VEIEX by 3.8 percentage points a year. Clearly, even over the most recent 10-year period, factor-based investing not only didn’t fail miserably, it didn’t fail at all. The only case of any meaningful underperformance was in U.S. small value. However, that underperformance was much less than the outperformance of factor-based funds internationally.
While we are on the subject of recency, it’s important that investors not make another common error. In my almost 25 years of experience as a financial advisor, I’ve learned that, when it comes to evaluating investments and investment strategies, most investors (both institutional and individual) think that three years is a long time, five years a very long time, and 10 years an eternity. On the other hand, financial economists know that 10 years can be nothing more than noise. Not understanding this leads to the problem of recency bias.
In case you are prepared to believe that 10 years of little to no value premium in the U.S. means that the value premium is dead, consider that there have been even longer periods in the U.S. where the market beta premium has been negative. In fact, there are three: the 15 years from 1929 through 1943 (-0.49%), the 16 years from 1966 through 1981 (-0.28%), and the 13 years from 2000 through 2012 (-0.02%). (Data is from Ken French’s website.) Hopefully, you would not have given up on belief in the equity premium based on those long periods. Similarly, you should not lose faith in the premiums in the other factors we have examined.
The fact is that all risky assets go through long periods of poor performance. That’s a reason to diversify across unique sources of risk, not avoid them after periods of poor performance. I also found it of interest that, in his column, Allan Roth noted that, even though international did poorly in the last 10 years, you should not abandon them. The same logic should apply to the size and value premiums, both of which have strong evidence of persistence, pervasiveness, robustness and have intuitive risk- and/or behavioral-based explanations for why they should persist. And you’ve seen evidence of their implementability (they survive transactions costs).
We have another important point to cover.
Has Popularity Destroyed the Value Premium?
One of the claims I’ve often heard is that the popularity of the value premium post-publication—cash flows into all these “smart beta” strategies—has killed the value premium. To address this issue, we’ll first look at the most recent research on this issue.
In their December 2018 study “Characteristics of Mutual Fund Portfolios: Where are the Value Funds?”, Martin Lettau, Sydney Ludvigson and Paulo Manoel provided a comprehensive analysis of portfolios of active mutual funds, exchange-traded funds (ETFs) and hedge funds through the lens of risk (anomaly) factors such as size, value and momentum. These are among their interesting findings:
- Funds do not systematically tilt their portfolios toward profitable factors, such as high book-to-market (BtM) ratios, high momentum, small size, high profitability and low investment growth. In fact, for some factors, mutual funds target the low-return leg of long/short factor portfolios rather than the high-return leg. This bias is especially strong for BtM ratios.
- There are virtually no high-BtM funds in the sample, while there are many low-BtM “growth” funds. For example, only seven of 2,657 funds in their sample have a BtM score in the fourth quintile or above (while 18 percent of S&P 500 stocks have a BtM score above 4). The bulk of “value” funds (mutual funds, ETFs and hedge funds) have BtM scores between 2 and 3.5. Further, value funds hold a larger portion of their portfolio in stocks in the lowest BtM quintile (24 percent) than in stocks in the highest BtM quintile (13 percent).
- Portfolios of “growth” funds are concentrated in low BtM-stocks, but “value” funds hold stocks across the entire BtM spectrum—more than half of all value funds hold a larger share of low-BM stocks than high-BM stocks, and only 7 percent hold more than 25 percent of their portfolio in high-BM stocks.
- Even funds with an explicit value objective hold a larger share of low BtM stocks than high-BtM stocks in their portfolios. This bias is present in other value/growth measures, such as the earnings-to-price and dividend-to-price ratios.
Lettau, Ludvigson and Manoel concluded:
Our results suggest that active mutual funds do not systematically hold the stocks with characteristics associated with high returns and thus are unlikely to contribute to any shrinking of factor premia during the sample period.
We can also look to valuations. If cash flows had eliminated the premium, we should observe a shrinking of the spread between valuations of growth and value stocks. With that in mind, we can examine the data.
I kept a table from a seminar Dimensional gave in 2000. It shows that at the end of 1994, the price-to-book (P/B) ratio of large-growth stocks was 2.1 times the P/B ratio of large-value stocks. Using Morningstar data, as of year-end 2018, the Vanguard Growth Index Fund (VIGRX) had a P/B ratio of 4.8, and the Vanguard Value Index Fund (VIVAX) had a P/B ratio of just 2.0—the spread has actually widened from 2.1 to 2.4. Thus, value stocks are cheaper today, relative to growth stocks, than they were shortly after Fama and French published their famous research.
We can also look at the P/E metric. In 1994, according to the Dimensional table, the ratio of the P/E in large-growth stocks relative to the P/E in large-value stocks was 1.5. As of year-end 2018, and again using Morningstar data, VIGRX had a P/E ratio of 17.8 and VIVAX had a P/E ratio of 12.3. Thus, the ratio, at 1.4, was virtually unchanged. So far, there’s no evidence here that cash flows have eliminated the premium.
We see similar results when we look at small stocks. The Dimensional data shows that, at the end of 1994, the P/B of the small stocks was about 1.5 times that of the P/B of small-value stocks. Again, using Morningstar data, the P/B of the Vanguard Small Growth Index Fund (VISGX) at 2.6 was 1.7 times that of the P/B of 1.5 of the Vanguard Small Value Index Fund (VISVX). Thus, the spread has widened, not narrowed. When we look at P/E ratios, we again see similar results.
At year-end 1994, the P/E of U.S. small growth stocks was 1.2 times that of the P/E of small value stocks. At year-end 2018, the P/E of VISGX at 18.8 was 1.6 times greater than the P/E of 11.7 for VISVX. Again, we see a widening of spreads. Thus, there is no evidence that popularity and resulting cash flows have killed the premium.
The bottom line is that there is no evidence to support the view that the value premium is dead. You cannot find it in valuations. And as you saw, value has outperformed internationally even over the most recent decade, when the premium disappeared in the U.S.
Before closing, it is important to cover one more point from Allan Roth’s post. It’s clear he dislikes the use of the term “smart beta.” On that we could not agree more. In fact, my ETF post of February 2, 2015, “Inside The ‘Smart Beta’ Hype,” explained why most of what is called smart beta is really nothing more than a marketing gimmick—the result of loading on factors (such as size, value, momentum and profitability/quality) other than market beta. In other words, most smart beta products aren’t delivering alpha, just beta on other factors. However, as my May 2014 post on Advisor Perspectives pointed out, there are some weaknesses with pure indexing strategies that can be minimized, if not eliminated. Creating fund construction and implementation rules (such as the use of patient algorithmic trading strategies) that do so could be described as smart beta. So while I dislike the term, it doesn’t quite make me sick, as William Sharpe proclaimed.
Simple, Not Easy
While smart investing is simple, it isn’t easy because of all the behavioral mistakes investors make (as humans, we are subject to many biases). Knowing the long-term historical evidence, ignoring what is very likely noise in short-term returns (and that means even periods of 10 years and longer), and knowing the long-term historical evidence can help you avoid mistakes. With that in mind, here’s my opinion about the prudent investment strategy.
Prudent Investing
The first premise is that the markets are highly, though not perfectly, efficient. That should lead you to invest in funds that do not engage in individual security selection or market timing. Instead, they focus on gaining exposure to factors that have demonstrated premiums that have been persistent, pervasive and robust to various definitions. They then use intelligent design and patient trading to minimize, or even eliminate, the negatives of pure index strategies.
The second premise follows from the first. If you believe that markets are highly efficient, it should follow that you also believe that all risky assets have similar risk-adjusted returns.
The third premise follows from the first two: If all risky assets provide similar risk-adjusted returns, you should diversify your portfolio across as many unique sources of risk and return as you can identify that meet the established criteria.
With those basic premises as the foundation, it’s important to understand that, while diversification has been called the only free lunch in investing, it doesn’t eliminate the risk of losses. And it requires accepting the fact that parts of your portfolio will behave entirely differently than the portfolio itself. And it may underperform a broad market index for a long time. In fact, a wise person once said that if some part of your portfolio isn’t performing poorly, you’re not properly diversified.
Diversification is hard. And because misery loves company, losing unconventionally is harder than failing conventionally. I would add that living through bad times is harder than observing them in backtests. All of this explains why it is so hard to be a successful investor—while achieving diversification is simple, living with it is hard. Knowing your level of tolerance for the dreaded disease known as “tracking error” regret (underperforming a popular index), and investing accordingly, will help keep you disciplined. Conversely, taking more tracking error than you can stomach is a prescription for failure.
The less tracking error you are willing to accept, the more the equity portion of your portfolio should look like the S&P 500 Index. On the other hand, if you choose a market-like portfolio, it will not be very diversified by sources of risk and will have little to no international diversification. At least between the two choices, avoiding or accepting tracking error risk, there is no free lunch.
As Michael
A quality investment philosophy is like a good diet: It only works if it is sensible over the long haul and you stick with it.” He also observed that “Investment philosophy is really about temperament, not raw intelligence.
The bottom line is that it is almost as important to get the balance between diversification and tracking error regret right as it is to determine the appropriate equity to bond allocation.

About the Author: Larry Swedroe
—
Important Disclosures
For informational and educational purposes only and should not be construed as specific investment, accounting, legal, or tax advice. Certain information is deemed to be reliable, but its accuracy and completeness cannot be guaranteed. Third party information may become outdated or otherwise superseded without notice. Neither the Securities and Exchange Commission (SEC) nor any other federal or state agency has approved, determined the accuracy, or confirmed the adequacy of this article.
The views and opinions expressed herein are those of the author and do not necessarily reflect the views of Alpha Architect, its affiliates or its employees. Our full disclosures are available here. Definitions of common statistics used in our analysis are available here (towards the bottom).
Join thousands of other readers and subscribe to our blog.