Everyone in finance remembers 2008–the Global Financial Crisis.
Yes, I know, the final downward movement in the stock market was in early 2009. However, many remember 2008 as the year of the crisis.
So now we are 10 years removed from the crisis.
Why do I mention this?
After the crisis, some began to question the logic/benefits of B&H investing. After all, a ~50% cut in the value of stocks can be painful. Yes, diversification matters; however, some of us are humans and tend to focus on individual pieces of the portfolio.
While there are many ways to deal with potential drawdowns (including asset class diversification), a popular and simple approach is to use trend-following within each asset class.
So below, I wanted to generate the returns to both B&H and Trend-Following for a variety of asset classes over the past decade.
Bottom line: Trend-following rules have caused a decade of absolute underperformance.
The Sample and Trend-Following Rules
To examine the results, I examined six common asset classes:
- U.S. Stocks — SP500
- Developed Int’l Stocks — EAFE
- Emerging Market Stocks — EEM
- Real Estate — REITs
- U.S. Gov’t Bonds — U.S. Treasuries, 7-10 year
- Commodities — GSCI
In addition, I plot the returns to Cash within the U.S., by the total return to 1-3 month Treasury Bills. All returns are total returns and include dividends, when applicable.
Below are the Compound Annual Growth Rates (CAGRs) to the B&H assets, from 1/1/2009 – 12/31/2018, gross of any fees or transaction costs:
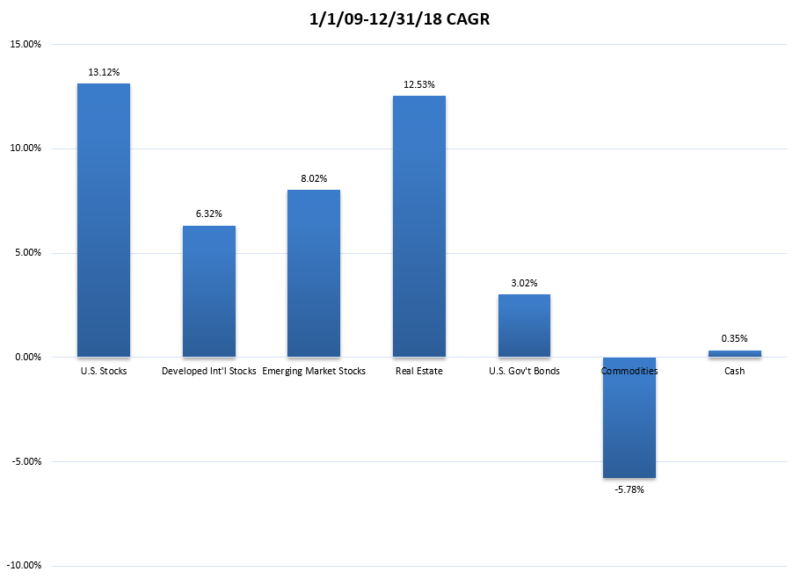
The results are hypothetical results and are NOT an indicator of future results and do NOT represent returns that any investor actually attained. Indexes are unmanaged, do not reflect management or trading fees, and one cannot invest directly in an index.
As you can see, U.S. stocks were the place to invest over the past 10 years. U.S. Real Estate was also a good bet, while Commodities were negative and International stocks (Developed and Emerging) lagged the U.S. market.
So how did Trend-Following do over the same time period?
Below I show the CAGRs to each asset class while applying two simple trend rules, both assessed monthly:
- Moving Average Rule–Current Total-Return Price compared to the Average of the Past 12-Months Total-Return Prices. If current > average, invest in the risk asset. If not, go to cash.
- Time-Series Momentum Rule–Compare the total return (TR) of each risk asset to the total return to cash over the past 12 months. If the TR for the risk asset > TR for cash, invest in the risk asset. If not, go to cash.
These two simple rules are similar, but not exactly the same. We give each a 50% weight, so one can either be 0%, 50%, or 100% invested in the risk asset. We discuss more on these rules here.
Below are the returns from 1/1/09-12/31/18, gross of any transaction costs, taxes, or fees. The B&H portfolio is in blue, and the trend-followed portfolio is in red.
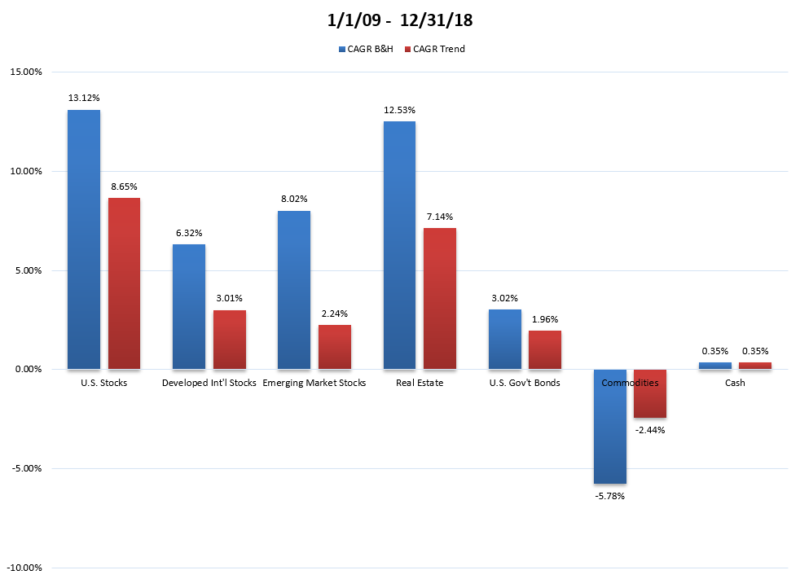
The results are hypothetical results and are NOT an indicator of future results and do NOT represent returns that any investor actually attained. Indexes are unmanaged, do not reflect management or trading fees, and one cannot invest directly in an index.
Fact–A decade of underperformance across most asset classes
With the lone exception of Commodities, B&H beat trend-following in every asset class. Also, remember that these are CAGRs (compound annual growth rates), so the difference would get compounded. Examining U.S. stocks, we see the B&H returned 13.12% whereas Trend returned 8.65%, for a difference of 4.47%.
To see what that is in dollar terms, we would need to compound over 10 years:
- $100 invested into B&H U.S. Stocks would have turned into $100*(1 + 13.12%)^10 = $343.08.
- Alternatively, $100 invested in U.S. Stocks with Trend would have turned into $100*(1 + 8.65%)^10 = $229.24.
For anyone using trend, unfortunately, they already know this math
Below I show the maximum drawdowns on each asset class, again gross of any transaction costs, taxes, or fees. Once again, B&H is in blue and Trend is in red.
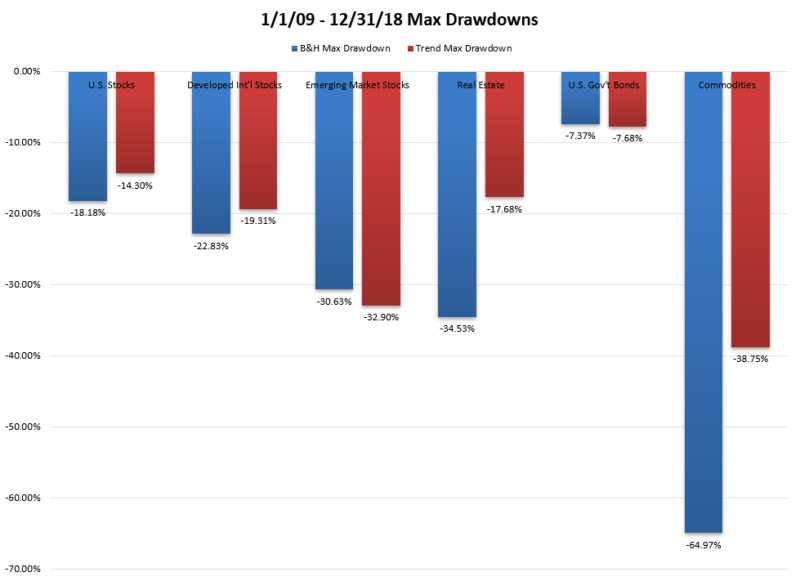
The results are hypothetical results and are NOT an indicator of future results and do NOT represent returns that any investor actually attained. Indexes are unmanaged, do not reflect management or trading fees, and one cannot invest directly in an index.
As you can see, the trend rules did little on drawdowns, save Commodities and Real Estate. However, over this time period, we know that there have been many “head-fakes” in the equity markets–U.S. Credit downgrade in 2011, a global slowdown fear in late 2015 and early 2016, and the more recent Q4 2018 decline. Each time markets are about to tank, the markets bounced back up, leaving trend-followers on the sideline missing out on returns. This definitely is the largest downside to trend-following, you will inevitably miss out on some returns, at some point in time.
It should also be pointed out that the returns shown above would be different if the trend signals were changed. Other methods include (1) different look-back periods, (2) assessing daily/weekly as opposed to monthly, and (3) using
However, most rules or combinations would generate similar returns–underperformance over the past decade.
So one may question–after a decade of losing, should one abandon trend-following?
The answer, as is the case with most investing questions, is “it depends”.
Why?
Well, let’s simply make one change to the study, and add one more year to our look-back period. This would involve us starting on 1/1/2008.
How did the portfolios perform over this time period?
Below are the returns from 1/1/08-12/31/18, gross of any transaction costs, taxes, or fees. The B&H portfolio is in blue, and the trend-followed portfolio is in red.
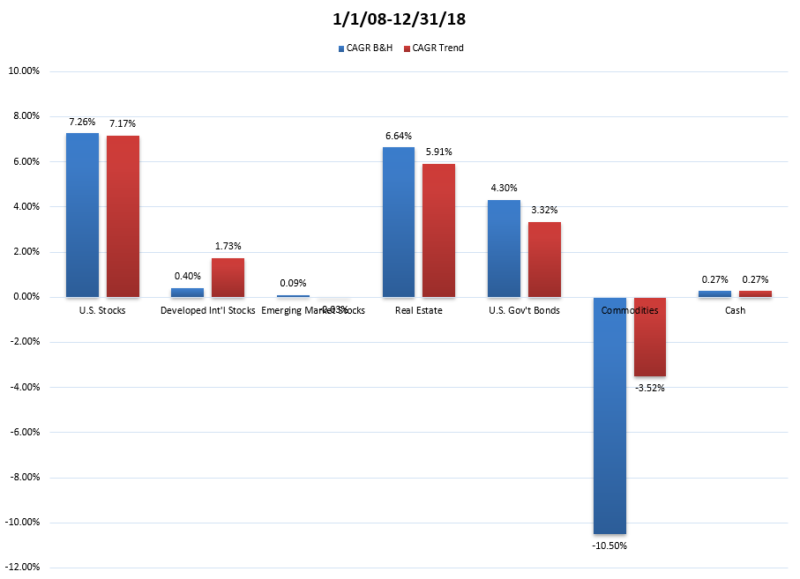
The results are hypothetical results and are NOT an indicator of future results and do NOT represent returns that any investor actually attained. Indexes are unmanaged, do not reflect management or trading fees, and one cannot invest directly in an index.
As we see, adding in one year, 2008, generates results showing B&H and Trend have similar CAGRs. Again, this is before any fees or transaction costs, but it is worth noting the performance is similar.
And as for drawdowns?
The maximum drawdowns on each asset class are shown below, again gross of any transaction costs, taxes, or fees. Once again, B&H is in blue and Trend is in red.
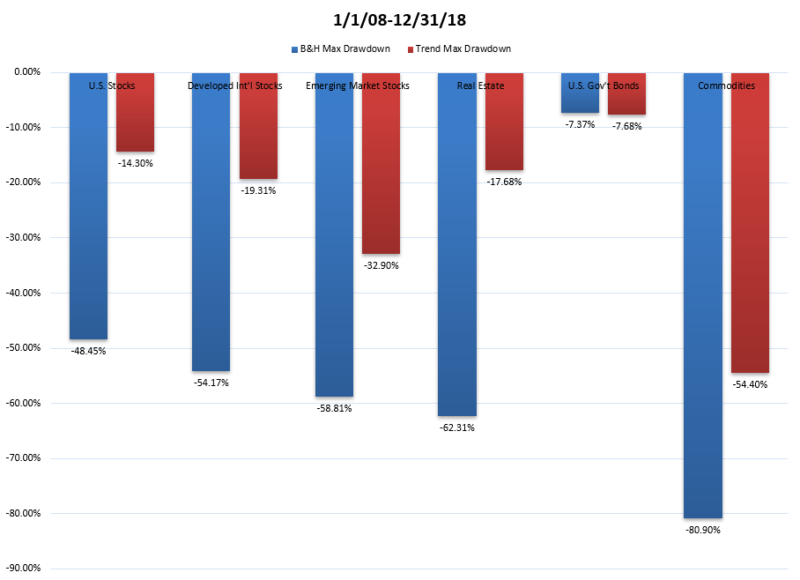
The results are hypothetical results and are NOT an indicator of future results and do NOT represent returns that any investor actually attained. Indexes are unmanaged, do not reflect management or trading fees, and one cannot invest directly in an index.
As one can see, when we include one additional year, 2008, we see how trend-following affected the drawdowns on each asset class.
So to the extent that large drawdowns matter to the end investor (i.e. those with utility functions placing a high value (utility) on not losing $$), and cannot be fully diversified away, trend-following might still have a place in the portfolio.
What’s the Takeaway on Trend Following?
The sobering fact is as follows–trend-following caused a decade of underperformance.
Including 2008 can make trend-followers feel better, but the past decade highlights the downside to trend-following–you will inevitably miss out on returns at some times.
As I highlight here, trend-following on U.S. stocks underperformed by around 3% (annualized!) from 1/1/1975-12/31/1999, a 26-year period! So this is definitely not a “new” event.
Overall, as we outline here, an economic rationale for trend-following to work in the future would be if investors’ risk aversion is dynamic, and investors become more risk-averse as prices get lower and expected returns rise.
However, as is shown above, trend-following is definitely not for everyone.

References[+]
| ↑1 | See Corey Hoffstein’s blogs for a detailed discussion on this |
|---|
About the Author: Jack Vogel, PhD
—
Important Disclosures
For informational and educational purposes only and should not be construed as specific investment, accounting, legal, or tax advice. Certain information is deemed to be reliable, but its accuracy and completeness cannot be guaranteed. Third party information may become outdated or otherwise superseded without notice. Neither the Securities and Exchange Commission (SEC) nor any other federal or state agency has approved, determined the accuracy, or confirmed the adequacy of this article.
The views and opinions expressed herein are those of the author and do not necessarily reflect the views of Alpha Architect, its affiliates or its employees. Our full disclosures are available here. Definitions of common statistics used in our analysis are available here (towards the bottom).
Join thousands of other readers and subscribe to our blog.