Seven Centuries of Commodity Reversals
- Adam Zaremba, Robert Bianchi, and
Matuesz Mikutowski - A version of this paper can be found here.
What are the research questions?
As the asset pricing research on the “very long-run” has been growing over the past years, it’s great to see a paper that sheds light on 700 years of Commodity Spot Price reversals.
The paper addresses the following research questions:
- Does the long-term price reversal in Commodity Prices persist back to 13th century?
- Do macro-economic variables explain reversals?
- Does return dispersion and volatility affect Reversals?
What are the Academic Insights?
- Yes, Commodity reversals persist back to 1265!
- No, authors do not find that
Reversal effect is driven by macro-economic factors. - Yes, authors find the effect the strongest among the more volatile commodities, following periods of high dispersion.
Why does it matter?
This paper is especially interesting for two reasons:
- It is the longest cross-sectional test of any strategy that we know of.
- It adds evidence documenting Commodity Spot price reversion over medium-term look-back periods typically associated with momentum continuation.
Traditionally, academic studies only documented Commodity reversals a) over look back periods of 3-5 years instead of 1-year and b) using the Near-Term commodity Futures price as a proxy for the Spot price.
Although longer-term (3-5 year) commodity reversals were well documented in academic research, there was a general understanding that over the shorter-term 1-year look-back timeframes, there is continuation of return via the Momentum effect, which is well documented in commodity futures.
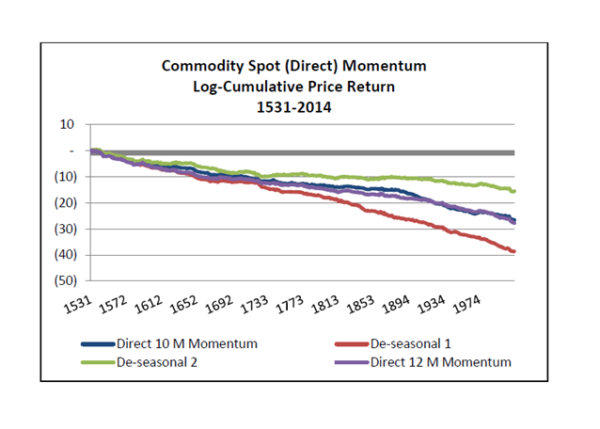
To my knowledge, my paper with Chris Geczy, “Two Centuries of Multi-Asset Momentum” (first draft 2015, latest 2017, and covered here by Alpha Architect) is the first paper that used actual Spot prices instead of the Near-Term future proxy to test for cross-sectional Momentum Effect. Our tests were monthly and extended back to 1531. And we discovered an inverse relationship from the one that exists in Commodity Futures: specifically, Momentum with look backs of 10-12 months produces a strong mean reversion instead of a continuation. In addition, we explored various ways to


In 2016, another paper (Chaves and Viswanathan: “Momentum and Mean-Reversion in Commodity Spot and Futures Markets”), confirms and further explores this divergence between Spot and Futures near-term momentum / reversal. And now, the new paper by Zaremba, Bianchi and Mikutowski confirms this effect over the longest time-frame back to 1265, adding an additional three centuries to the prior five centuries of evidence.
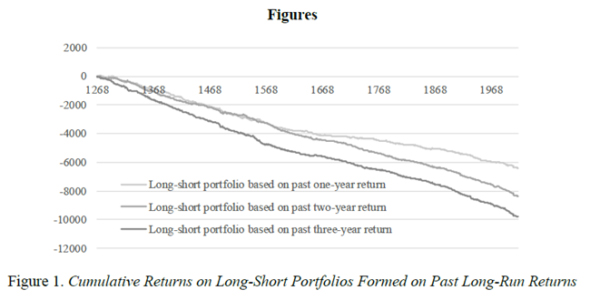
The most important chart from the paper

When sorted into quintiles, the authors document a Long-Short mean reversion spread of 8.55% per year with one year look back for 52 commodities (similar to Geczy, Samonov (2017) who document a spread of 6.84% per year using 76 commodities). In addition, the authors document an 11.21% return per year using a two-year look back.
Of course, for any investor to profit from this strategy, they would need to buy, store and short-sell the actual physical commodities, adding storage costs and other frictions. Unlike the futures prices, the spot prices are gross of these additional costs.
The Puzzle
Overall, the puzzle of cross-sectional near-term Commodity Spot reversal is a relatively new discovery and still unexplained, especially because the effect is opposite when defined using commodity futures. It is not just that commodities tend to mean-revert faster than other asset classes, but that the Futures exhibit momentum while the Spot prices exhibit mean reversion over identically defined portfolio formations.
Potential Explanations
Zaremba, Bianchi and Mikutowski argue that the most likely explanation is the lagged production adjustments in response to changes in demand and supply. On a similar thread, Geczy and Samonov test a hypothesis that commodities that have traded Futures Contracts do not exhibit the mean reversion of the Spot prices because of the presence of financial instruments which allows the markets to work more efficiently for hedgers and speculators. In the table and graph below, they separate the results for commodities that have a traded futures after 1959 (a group of 46 commodities), and a group that does not (30 commodities). You can see that mean reversion disappears in the 46 group. In contrast, mean reversion strengthens further in the 30 commodious that do not have a futures contract. So perhaps the introduction of commodity futures contracts makes Spot Price reversion disappear

The results are hypothetical results and are NOT an indicator of future results and do NOT represent returns that any investor actually attained. Indexes are unmanaged and do not reflect management or trading fees, and one cannot invest directly in an index.

While the presence of futures alone does not explain the source of the original mean reversion, it might give clues to future researchers, and it adds evidence that financialization of commodity markets potentially does have an impact on the efficiency of the underlying prices (a debate that has been going on).
Overall, the mean reversion in Spot Prices is probably not a reliable investment strategy going forward both because of high costs of storing commodities, difficulty in shorting physical commodities, and because the effect seems to disappear when futures are introduced.
Abstract
We perform the longest study of long-run reversal in commodity returns ever conducted. Using a unique dataset of prices of 52 agricultural, industrial, and energy commodities, we examine the price behaviour for the years 1265 to 2017. The findings reveal a strong and robust long-run reversal effect. The returns of the past one to three years negatively predict subsequent performance in the cross-section of returns. The long-run reversal effect is present in both agricultural and non-agricultural commodity returns across all centuries and is independent of market states. The long-run reversal cannot be explained by macroeconomic risks. The phenomena is elevated in more volatile commodities and in periods of high return dispersion.
About the Author: Mikhail Samonov
—
Important Disclosures
For informational and educational purposes only and should not be construed as specific investment, accounting, legal, or tax advice. Certain information is deemed to be reliable, but its accuracy and completeness cannot be guaranteed. Third party information may become outdated or otherwise superseded without notice. Neither the Securities and Exchange Commission (SEC) nor any other federal or state agency has approved, determined the accuracy, or confirmed the adequacy of this article.
The views and opinions expressed herein are those of the author and do not necessarily reflect the views of Alpha Architect, its affiliates or its employees. Our full disclosures are available here. Definitions of common statistics used in our analysis are available here (towards the bottom).
Join thousands of other readers and subscribe to our blog.

