A Guide to ESG Portfolio Construction
- Michael Branch, Lisa R. Goldberg and Pete Hand
- Journal of Portfolio Management
- A version of this paper can be found here
- Want to read our summaries of academic finance papers? Check out our Academic Research Insight category
What are the research questions?
As with all types of investors, portfolio construction will vary depending on the goals of the ESG investor. Although it may be exceedingly difficult to enact social change via investing, ESG investors continue to seek strategies that are aligned with their goals and objectives.
In this article, three categories of construction approaches to building an ESG portfolio are analyzed. Typical ESG aspects are considered: securities in industries including Oil & Gas, Soft drinks, Tobacco, Alcohol, Packaged foods and Women serving on boards. The construction options vary from simple to complex, but each strives to match the portfolio to ESG goals as well as risk targets using variations on three options:
- Option 1: Excluding unwanted securities from the portfolio either by capitalization weighted exclusion (low risk aversion) OR optimized exclusion (high risk aversion).
- Option 2: Scoring ESG securities to exclude from the portfolio by maximum ESG score (low risk aversion) OR minimized risk (high risk aversion). This is basically tilting the portfolio one way or the other towards a specific theme.
- Option 3: Combination of Scoring and Exclusion to tilt the portfolio towards a theme and exclude undesirable securities.
What are the Academic Insights?
The analysis is focused on the tradeoff between higher tracking error versus unwanted or objectionable exposures. When undesirable securities are excluded or underweighted within an optimization framework, a byproduct of risk minimization leads to overweighting securities that are “correlated” with the excluded securities. In order to achieve tracking error or total risk targets, close substitutes for the excluded securities are likely to be included. This is often in conflict with ESG objectives.
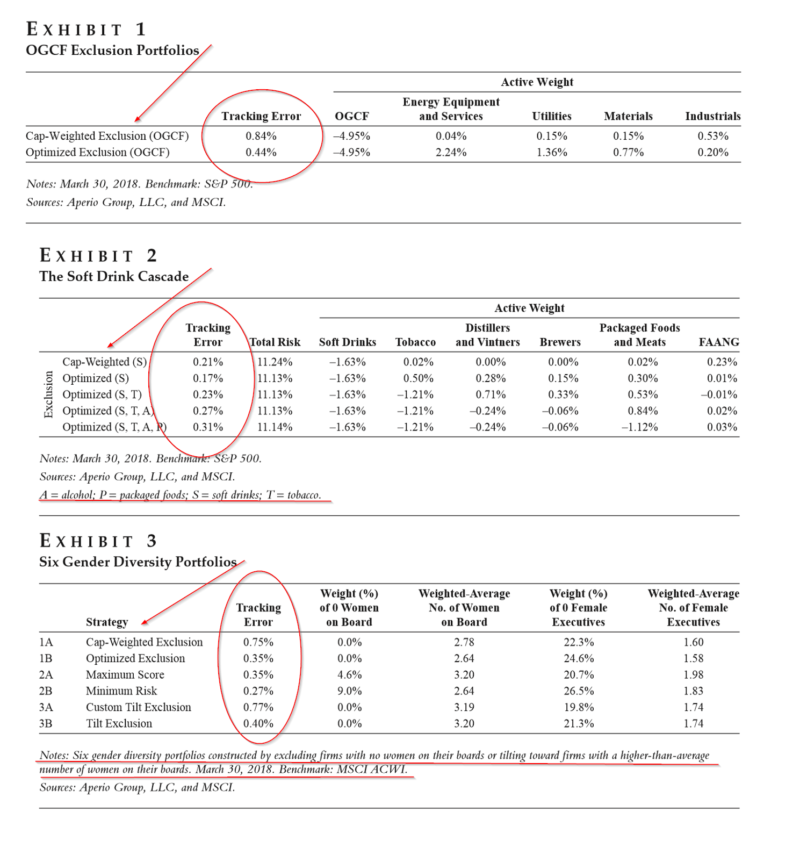
- Tradeoff results for the basic exclusion strategy (option 1) are presented in Exhibit 1 for portfolios excluding stocks in the Oil & Gas industry. The tracking error of the cap-weighted exclusion of O&G stocks is almost twice that of the optimized variation. However, the optimized variation trades off lower risk for significant overweights in industries such as Energy Equipment and Services that are correlated with O&G and may be objectionable to the ESG investor.
- For the cap-weighted exclusion: The higher TE comes about as the rise in stock specific risk, due to the exclusion, is not offset in any other portion of the portfolio. The strategy may be appropriate for a low risk averse ESG investor willing to bet that the excluded stock(s) will underperform.
- For the optimized exclusion, TE of 44bps will deliver almost benchmark-like performance in terms of returns. Suitable for a high risk-averse investor, but little to no alpha.
- Exhibit 2 is a bit more complicated. The cap-weighted versus optimization exclusion is further documented by adding exclusions sequentially. Note that TE again drops when Soft drinks (S) are excluded and optimized. However, other subindustries (Tobacco, Alcohol, Packaged foods) correlated with Soft drinks are overweighted in the tradeoff for lower risk, in a cascading fashion. In response to the inclusion of objectionable overweights in the sequential optimizations, TE increases. The portfolio necessarily moves to a lower level of mean-variance efficiency. Depending on the social and risk preferences of the ESG investor, an argument for a number of the resulting portfolios can be made. One portfolio does not fit all ESG investors.
- The results of the customized tilt exclusion and basic tilt exclusion approaches are presented in Exhibit 3, in Rows 3A and 3B. ESG scores for securities reflecting Women on boards as well as exclusions of firms with no Women on boards are used to obtain the exposures reported. The two portfolios have the same zero exposure to firms with no women on boards, and almost identical exposures to the 3 other “Women” factors. However, they differ with respect to TE due to different benchmarks used for minimizing TE. The customized tilt exclusion (TE at 77bps) was optimized with the cap-weighted exclusion, in Row 1, used as the benchmark. The basic tilt exclusion portfolio was optimized (TE at 40bps) to a normal diversified benchmark.
Why does it matter?
This article is the first that I have seen that begins to explore the nuts and bolts of ESG portfolio construction. It clearly lays out the essential tradeoff between effective risk control while tilting towards ESG factors and unwanted outcomes. The authors argue that portfolio construction for ESG investors is necessarily more challenging than is the usual case and that “one size does not fit all”. Quant methods such as optimization and scoring securities on ESG criteria, are very effective at reducing risk and achieving very specific ESG exposures. However, these approaches may also lead to objectionable, from an ESG point of view, exposures within the portfolio.
One Caveat: Although the objectionable exposures may be handled with adding constraints to the optimization process, it will surely move the ESG portfolios to a lower level of efficiency in the risk/return set of opportunities.
The authors conclude:
…although ESG portfolios are more complicated and less transparent than portfolios based solely on financial considerations, the usual rules apply. Effective ESG investing is a complex process that necessarily involves a trade-off between risk and getting more of what you want, be it financial return or peace of mind.
The most important chart from the paper
Abstract
In this article, the authors explore six quantitative environmental (E), social (S), and governance (G) strategies to provide insights into best practices for ESG portfolio construction. These strategies offer different approaches to the trade-off between desired ESG attributes and investment performance. They conclude that fully understanding the dynamics of these trade-offs will allow investors to select the strategy that best matches their ethical and financial views.

About the Author: Tommi Johnsen, PhD
—
Important Disclosures
For informational and educational purposes only and should not be construed as specific investment, accounting, legal, or tax advice. Certain information is deemed to be reliable, but its accuracy and completeness cannot be guaranteed. Third party information may become outdated or otherwise superseded without notice. Neither the Securities and Exchange Commission (SEC) nor any other federal or state agency has approved, determined the accuracy, or confirmed the adequacy of this article.
The views and opinions expressed herein are those of the author and do not necessarily reflect the views of Alpha Architect, its affiliates or its employees. Our full disclosures are available here. Definitions of common statistics used in our analysis are available here (towards the bottom).
Join thousands of other readers and subscribe to our blog.