What follows is a basic discussion on our long-only Focused Value and Momentum Factor Indexes. Additional information on these Indexes, as well as our alternative and tactical indexes, are available on our Index site.(1)
For advanced users, we provide quarterly attribution materials and a wealth of additional analytics on our index site. The goal of the site is to enhance the transparency and understanding of our processes.
Focused Factors Index Background
Readers can learn more about the underlying processes of our Focused Factor Indexes via the links below:
- Quantitative Value Index (QV INDEX)
- International Quantitative Value Index (IQV Index)
- Quantitative Momentum Index (QM INDEX)
- International Quantitative Momentum Index (IQM Index)
The process for the Quantitative Value Indexes can be summarized as follows:
The Index seeks to buy the cheapest, highest quality value stocks
The process for the Quantitative Momentum Indexes can be summarized as follows:
The Index seeks to buy stocks with the highest quality momentum.
Index Active Share
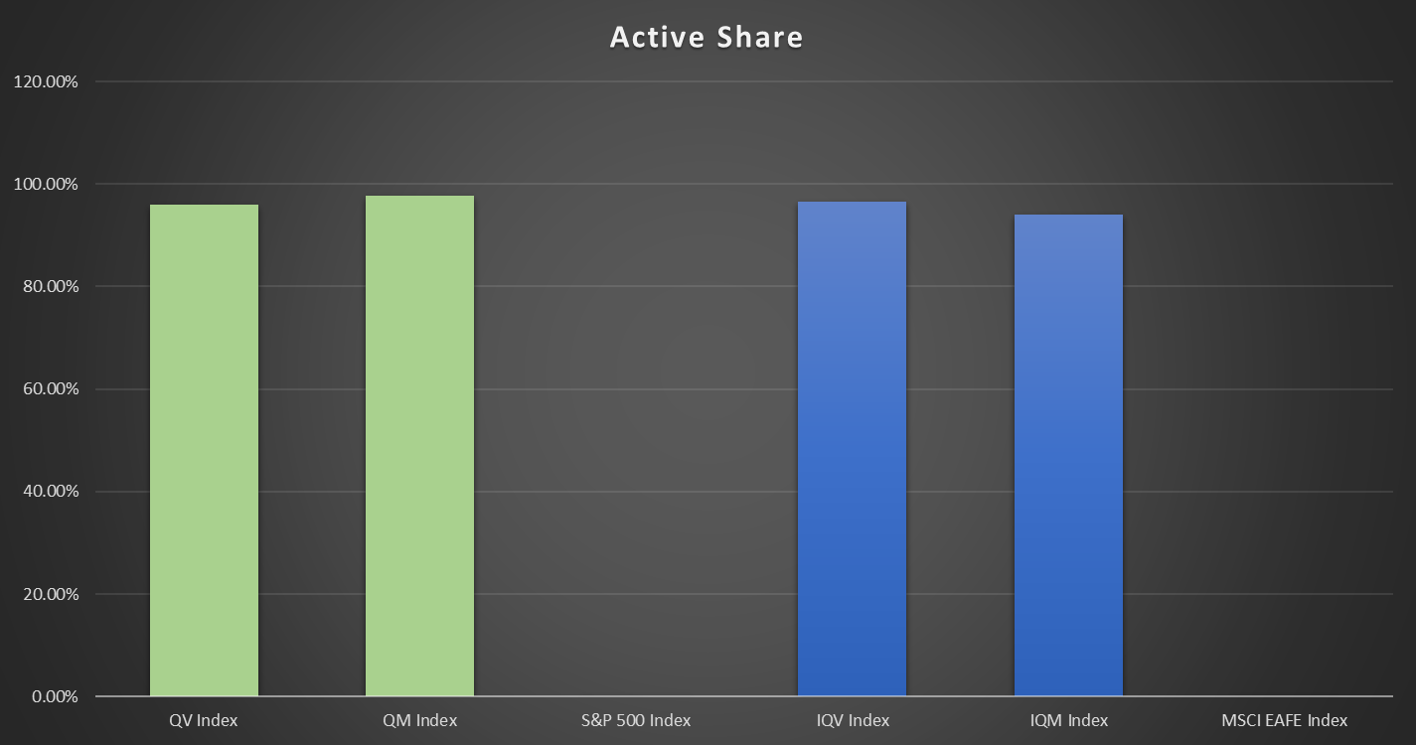
Source: FactSet. The results are hypothetical results and are NOT an indicator of future results and do NOT represent returns that any investor attained. Please see disclosures for additional information. Additional information regarding the construction of these results is available upon request. Indexes are unmanaged, do not reflect management or trading fees, and one cannot invest directly in an index. Active share is the percentage of a portfolio’s stock holdings that differ from its benchmark index. It is based on the weightings of securities in a portfolio compared with those of the benchmark and can be used as a measure of the degree of a portfolio’s active management. For example, an 80% active share means that 80% of the fund’s holdings deviate from its benchmark.
Active Share Summary
Our Quantitative Value and Quantitative Momentum Indexes exhibit a high degree of differentiation from standard benchmarks.
Active Share Details
- Active Share = A measure of how different a strategy is from a benchmark. (details)
- US Index Benchmark = S&P 500
- International Index Benchmark = MSCI EAFE
Quantitative Value Index Key Characteristics
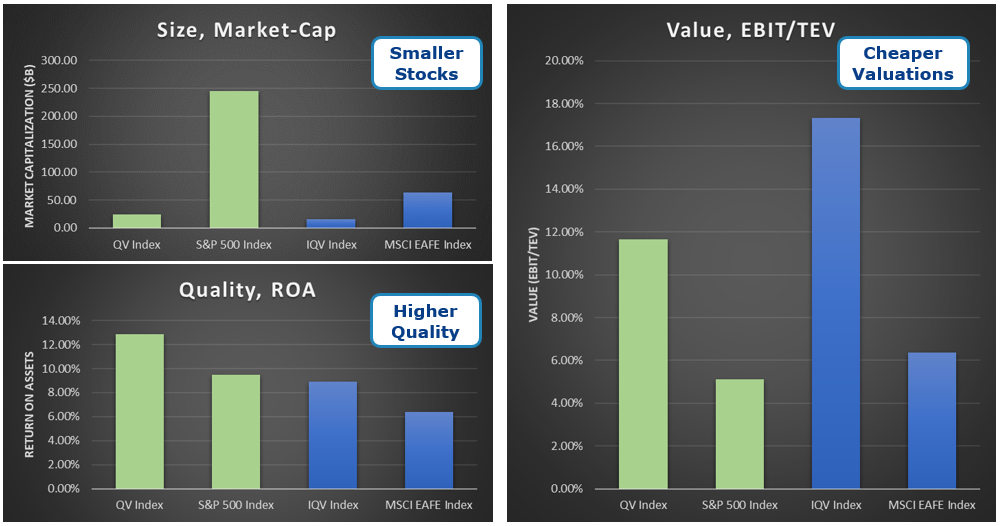
Please see disclosures for additional information. Additional information regarding the construction of these results is available upon request. Indexes are unmanaged, do not reflect management or trading fees, and one cannot invest directly in an index. Characteristics are from FactSet and derived via the ETFs that track the respective Indexes. Characteristics are holdings-weighted.
Quantitative Momentum Index Key Characteristics
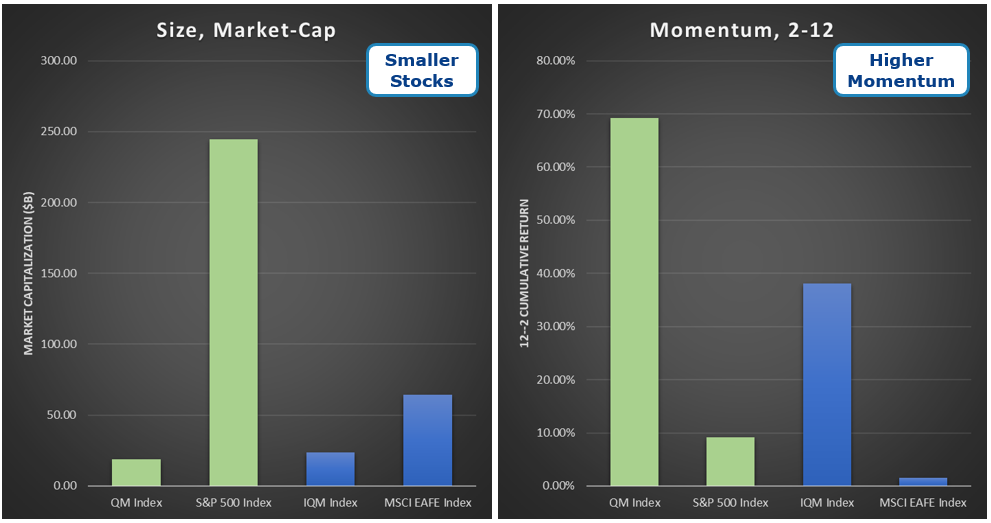
Key Characteristics Summary
- Value (QV and IQV Indexes)
- Smaller, cheaper, and higher quality than the market-cap-weighted Indexes.
- Momentum (QM and IQM Indexes)
- Smaller and higher momentum than the market-cap-weighted Indexes.
Key Characteristics Details
- Size = Market Capitalization
- Value = EBIT/TEV (details)
- Momentum = 12-2 Momentum (details)
- Quality = Return on Assets
Index Performance Summary
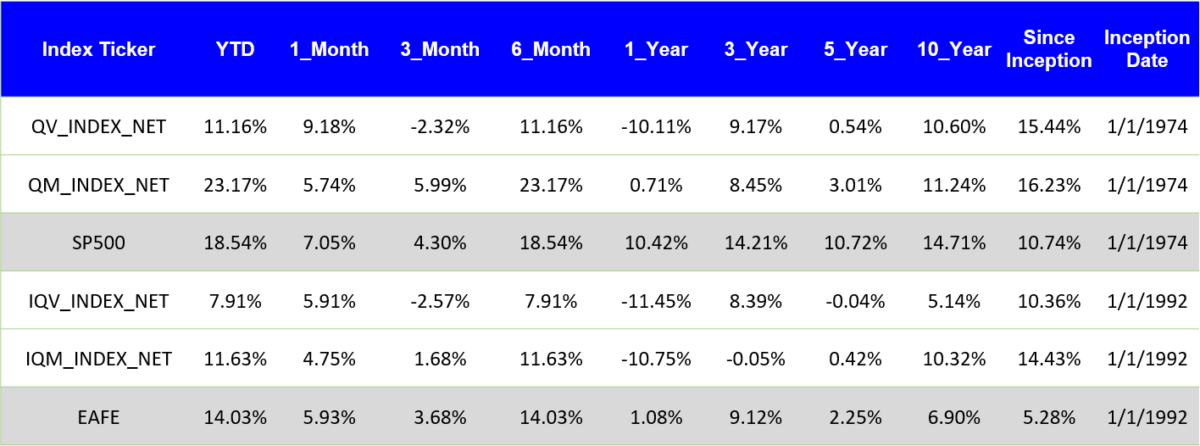
The results are hypothetical results and are NOT an indicator of future results and do NOT represent returns that any investor attained. Please see disclosures for additional information. Additional information regarding the construction of these results is available upon request. Indexes are unmanaged, do not reflect management or trading fees, and one cannot invest directly in an index
Performance Summary
- QV lost 2.23% in Q2, bringing the 12-month figure to -10.11%.
- IQV lost 2.57% in Q2, bringing the 12-month figure to -11.45%.
- QM gained 5.99% in Q2, bringing the 12-month figure to 0.71%.
- IQM gained 1.68% in Q2, bringing the 12-month figure to -10.75%.
Performance Commentary
- How factors contributed to US returns
- For Q2 2019, beta (market), momentum, and quality factors outperformed the broad market.
- Momentum and Quality were positive in Q2, size and value were negative for Q2. We still believe owning cheap instead of expensive stocks and strong instead of weak stocks will work over the long term.
- Value and momentum proved to be relatively uncorrelated, which is in line with historical expectations.
- How factors contributed to International returns
- For Q2 2019, beta (market), momentum, and quality factors outperformed the broad market.
- Momentum and Quality were positive in Q2, size and value were negative for Q2. We still believe owning cheap instead of expensive stocks and strong instead of weak stocks will work over the long term.Value and momentum proved to be relatively uncorrelated, which is in line with historical expectations.
- Additional thoughts
- Q2 2019 returns were muted relative to the snapback in prices in Q1. The relatively uncorrelated returns of the value and momentum indexes is encouraging, as this is in line with historical expectations.
Additional details are available on our index site.
Disclosures
- All returns are total returns and include the reinvestment of distributions (e.g., dividends).
- QV INDEX NET = Quarterly rebalanced, equal-weight, total returns including dividends. Alpha Architect calculations through 10/31/2014; Solactive calculations thereafter (Official index is QVAL Index). Net 2% in costs.
- QM INDEX NET = Quarterly rebalanced, equal-weight, total returns including dividends. Alpha Architect calculations through 12/31/2015; Solactive calculations thereafter (Official index is QMOM Index). Net 2% in costs.
- IQV INDEX NET = Semi-annually rebalanced, equal-weight, total returns including dividends. Alpha Architect calculations through 12/31/2014; Solactive calculations thereafter (Official index is IVAL Index). Net 2% in costs.
- IQM INDEX NET = Quarterly rebalanced, equal-weight, total returns including dividends. Alpha Architect calculations through 12/31/2015; Solactive calculations thereafter (Official index is IMOM Index). Net 3% in costs.
- SP500 = S&P 500 Total Return Index.
- EAFE= MSCI EAFE Total Return Index.
- Performance figures contained herein are hypothetical, unaudited and prepared by Alpha Architect, LLC; hypothetical results are intended for illustrative purposes only. Past performance is not indicative of future results, which may vary. Index returns are for illustrative purposes only and do not represent actual fund performance. Index performance returns do not reflect any management fees, transaction costs, or expenses, which would reduce returns. Indexes are unmanaged and one cannot invest directly in an index.
- Please see the disclosures at the end of this document for additional information.

References[+]
| ↑1 |
Free to use, but we do screen users to avoid malicious intent and to minimize server loads. Sign up here. |
|---|
About the Author: Wesley Gray, PhD
—
Important Disclosures
For informational and educational purposes only and should not be construed as specific investment, accounting, legal, or tax advice. Certain information is deemed to be reliable, but its accuracy and completeness cannot be guaranteed. Third party information may become outdated or otherwise superseded without notice. Neither the Securities and Exchange Commission (SEC) nor any other federal or state agency has approved, determined the accuracy, or confirmed the adequacy of this article.
The views and opinions expressed herein are those of the author and do not necessarily reflect the views of Alpha Architect, its affiliates or its employees. Our full disclosures are available here. Definitions of common statistics used in our analysis are available here (towards the bottom).
Join thousands of other readers and subscribe to our blog.