Explaining the Demise of Value Investing
- Baruch Lev and Anup Srivastava
- A version of this paper can be found here
- Want to read our summaries of academic finance papers? Check out our Academic Research Insight category
What are the research questions?
It’s no secret that value has had a bad bout of performance in recent memory. This underperformance has been thoroughly examined by multiple research teams and we’ve done some of our own work on the subject. We’ve also done in-depth rebuttals to “value investing is dead” articles in the past (Alternative Facts about Formulaic Value Investing, The Re-Death of Value, or Déjà Vu All Over?, and, After a Lost Decade, Will Value Get its Groove back in 2019?). The paper is a good one to read if you are a believer in the value investment philosophy and you are looking for research that is counter to your current beliefs. There are some interesting points to consider throughout the paper, but it is unclear if there is enough evidence to flip a value investor into a growth investor.
This paper looks at the reasons why value has underperformed by answering these three questions:
- Why did value investing begin to falter in the late 1980s
- Why did value fall off a cliff in 2007?
- Is value investing really dead?
What are the Academic Insights?
- 3 ACCOUNTING REASONS:
- Accounting-related measurement errors in the book value of equity including the incorporation of one-time events that are immaterial to and may have distorted valuation;
- Changes in accounting rules that increasingly imparted a conservative bias in the measurement and reporting of earnings (more restrictive rules on the recognition of revenues, e.g.);
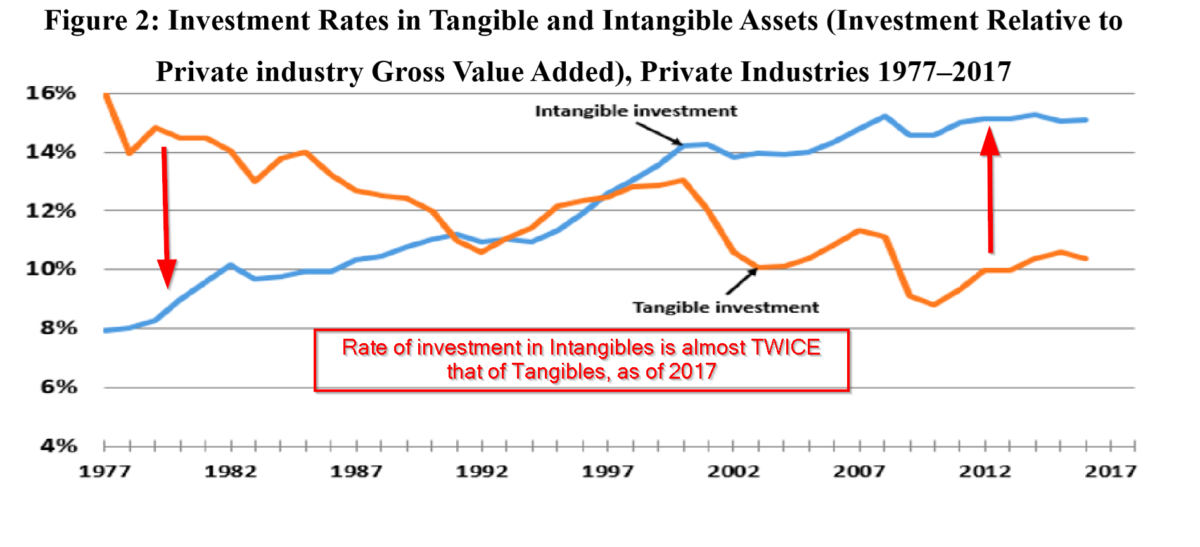
- The immediate expensing of investments in intangibles (that is, internally generated expenses associated with R&D, IT, HR, and Marketing) that were expected to create value beyond the current reporting period. All 3 of these influences have exerted downward pressure on BV via the retained earnings portion of the balance sheet. In particular, the growth of corporate investment in Intangibles that began in earnest in the late 80s, corresponded to the period when value began to fade as a strategy. The median market to book ratio tripled between the mid-80s and 2018. See Figure 2 below: Starting in the late 80s, investing in Intangible assets began to exceed that of Tangibles. Following that, negative return spreads to value were then observed in the 90s, with a brief resurgence of positive returns from 2000 to 2006. The authors argue that the negative returns that resumed during the period 2007 to the present, are less related to the mismeasurement issue and more related to a slowdown in mean reversion between the rankings of value and glamour stocks.
- MEAN REVERSION. Specifically, a slowdown in mean reversion between the prices of value stocks (where low ranked stocks rise in price) and glamour stocks (where high ranked stocks fall in price) due primarily to changes in fundamental conditions. Slower mean reversion in VG prices was indicated by the following:
- Increases in the rank correlations: During the period 1989 to 2018, the authors calculate a substantial increase in the rank correlation for value stocks in terms of the relative market to book ranking at the end of each period and it’s ranking in the previous period. The average rank correlation increased from a little over 55% to a little over 65% for the period studied. The rank correlation for glamour stocks increased from a little over 45% to 60%, over the same period;
- Longer stays in the VG portfolios: For Value the average stay increased from 2.5 years to 3.3 years. For Glamour it increased from 3.5 to 4.5 years.
- And lower frequencies of upticks (at least 10%) for Value and downticks (10%) for Glamour. This measure is most directly driven by mean reversion and obviously related to the gains from the VG spread. For Value, the frequency of upticks declined from 22% to 10%. For Glamour, downticks declined from 18% to 10%.
- PRETTY MUCH DEAD. The authors argue the economic causes of the slowdown in mean reversion for Value include plummeting profitability in terms of ROE, RNOA and historic annual losses, due to substantial operational problems during 2007-2018. Declines in profitability and historic declines in internal funds prohibited Value stocks from investing in R&D, IT, Marketing, etc. Essentially keeping them trapped in the low-value category and pushed into regulated industries loaded with tangible assets that require massive investments for any hope of a turnaround. The contrasting case is made for Glamour: the slowdown in mean reversion is a function of exactly the opposite conditions: high profitability, investments in intangibles, etc. Under those conditions, the motivation for shorting Glamour since 2007 has been weak, to say the least. Overall, the authors make a convincing but very grim case for the resurrection of value investing.
Why does it matter?
The paper is a good one to read if you are a believer in the value investment philosophy and you are looking for research that is counter to your current beliefs.
Also, on a technical note, there is one caveat we’d like the authors to explore a bit further: The authors make use of the Lakonishok (LSV Contrarian paper, JF, 1994) behavioral explanation of Value and Glamour to argue their case but use the Fama French data set to test their case. This could be a problem as the two sets of value stocks are substantially different. The characteristics of a value or glamour stock will vary depending on the methodology used. The LSV method uses a simultaneous sort on cashflow to price and growth in sales. This results in a much “deeper” value (and glamour) set of stocks when compared to the traditional FF HML. The LSV formulation is consistent with their view of the behavioral driver, overextrapolation, of the V-G return spread. In contrast, the FF formulation is a one-way sort on book-to-market, formulated to capture the increased risk associated with a value stock. Two very different propositions.
Would the same results be observed using an LSV type dataset? I’m not sure. Perhaps the overextrapolation effect in the pricing of LSV-style vs HML-style value stocks has varying susceptibilities to accounting and mean reversion explanations? Just a thought.
The most important chart from the paper
Abstract
The business press claims that the long-standing and highly popular value investing strategy— investing in low-valued stocks and selling short high-valued equities—lost its edge since 2007. The reasons for this putative sudden demise of value investing elude investors and academics, making it a challenge to assess the likelihood of the return of value investing to its days of glory. Based on extensive data analysis we show that the strategy has, in fact, been unprofitable for almost 30 years, barring a brief resurrection following dotcom bust. We identify two major reasons for the demise of value: (1) accounting deficiencies causing systematic misidentification of value, and particularly of glamour (growth) stocks, and (2) fundamental economic developments which slowed down significantly the reshuffling of value and glamour stocks which drove the erstwhile gains from the value strategy. We end up by speculating on the likelihood of the resurgence of value investing, which seems low.

About the Author: Tommi Johnsen, PhD
—
Important Disclosures
For informational and educational purposes only and should not be construed as specific investment, accounting, legal, or tax advice. Certain information is deemed to be reliable, but its accuracy and completeness cannot be guaranteed. Third party information may become outdated or otherwise superseded without notice. Neither the Securities and Exchange Commission (SEC) nor any other federal or state agency has approved, determined the accuracy, or confirmed the adequacy of this article.
The views and opinions expressed herein are those of the author and do not necessarily reflect the views of Alpha Architect, its affiliates or its employees. Our full disclosures are available here. Definitions of common statistics used in our analysis are available here (towards the bottom).
Join thousands of other readers and subscribe to our blog.