INTRODUCTION
Factor investing is hard and some factors make it harder than others. A value strategy results in a portfolio of stocks that exhibit temporary or structural issues and are usually rated “Sell” by brokers, which makes these emotionally challenging to hold. Small caps are companies that are unknown to most investors and lack the prestige associated with investing in firms like Apple or Amazon.
Buying momentum stocks is easy given that they represent recent winners, but might leave investors questioning what happens when trends revert. A Low Volatility strategy is highly appealing from a risk perspective but results in a portfolio of unexciting stocks, which is equally difficult to hold. Or as Wes eloquently put it; Academic Factor Portfolios are Extremely Painful. Unless you are an Alien.
Investors evaluating multi-factor portfolios might want to consider combining Momentum and Low Volatility as it likely creates the least amount of emotional pain compared with other factor combinations. Such a portfolio would include recent winners, aka the feel-good stocks, but only those with relatively low risk, which should help to avoid stocks on steroids.
In this short research note, we will explore the performance and construction of Low Volatility-Momentum (LOVM) portfolios in the US.
MULTI-FACTOR MOMENTUM AND LOW-VOLATILITY PORTFOLIO CONSTRUCTION
We focus on all stocks in the US stock market above a market capitalization of $1 billion. Combining factors into a multi-factor portfolio can be achieved by three methodologies, which are as follows:
- Intersectional Model: The universe of stocks is sorted simultaneously by both factors and the stocks in the intersection are chosen.
- Sequential Model: Stocks are first ranked by one factor and the resulting universe of stocks is then sorted by a second factor.
- Combination: The universe of stocks is sorted by factors separately and the two portfolios are then combined.
We create long-only Low Volatility-Momentum portfolios by utilizing these three methodologies. The stocks are weighted by market capitalization, rebalanced monthly, and include 10 basis points of costs for each transaction. The portfolios are constructed to hold the same amount of stocks, which is 10% of the universe and therefore relatively concentrated. As of the end of 2018, each of the three portfolios held approximately 180 stocks.
LOV-VOLATILITY AND MOMENTUM PERFORMANCE
We observe that all LOVM portfolios outperformed the US stock market in the period from 1989 to 2018, on an absolute as well as a risk-adjusted basis. The portfolios created with the Intersectional and Sequential models performed relatively similar while the Combination portfolio generated the highest return.
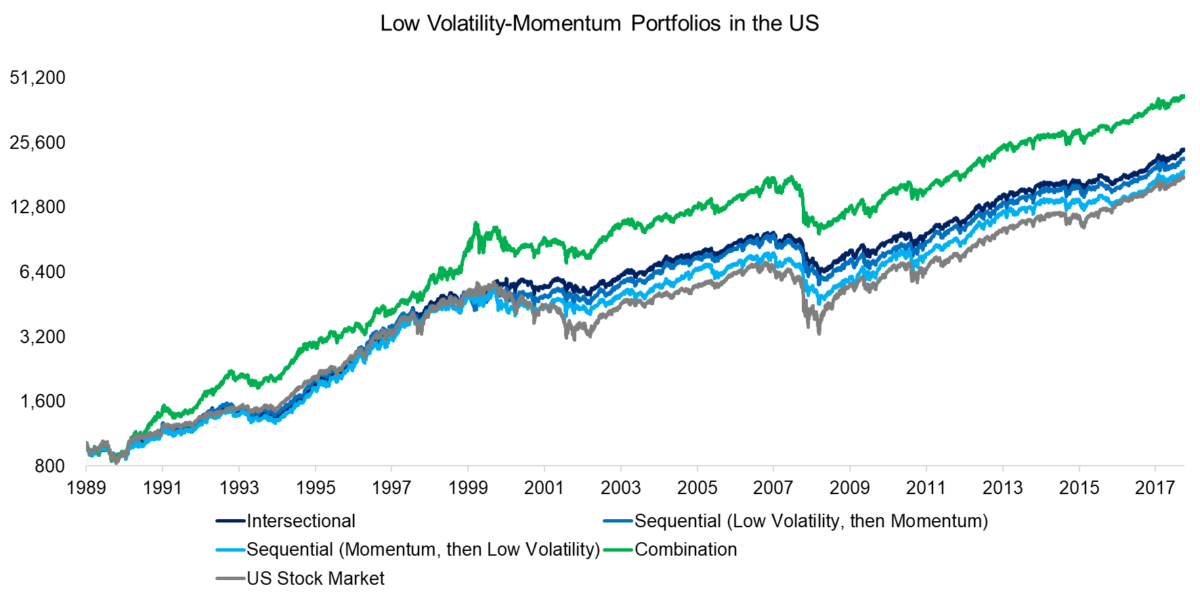
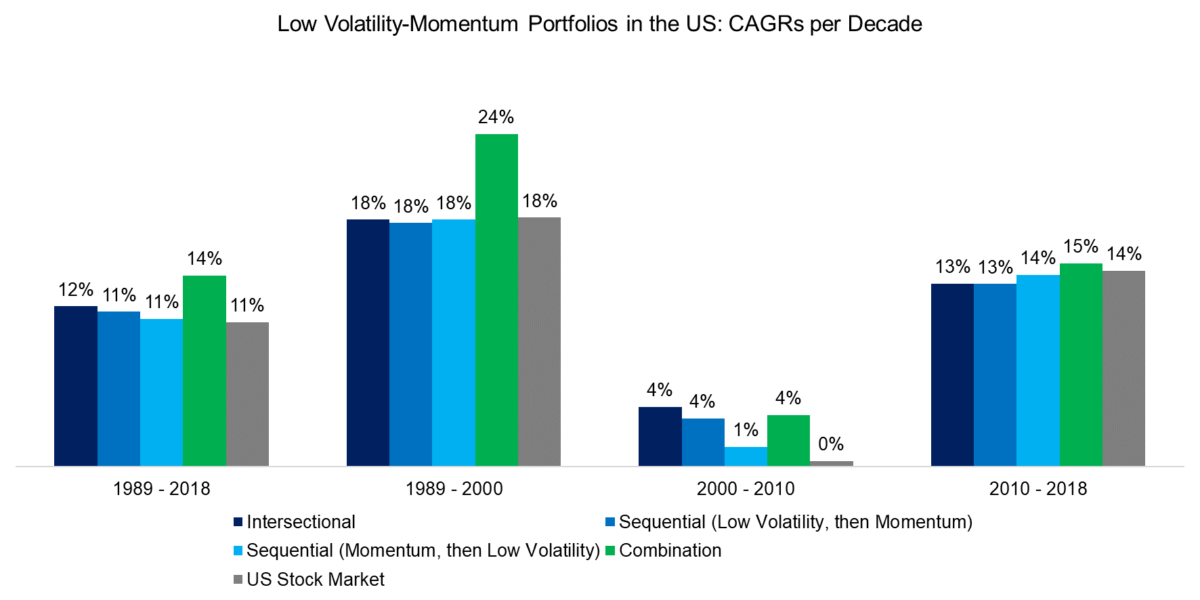
It is interesting to explore whether the LOVM portfolios outperformed the stock market consistently over time or only during certain periods. Therefore, we calculate CAGRs per decade and observe that most of the positive excess returns were generated from 2000 to 2010, where the stock market provided almost no return due to the tech bubble implosion in 2001 and the great financial crisis in 2008 to 2009.
The Combination portfolio is only one that consistently outperformed the market, although it was also the most volatile. The Low Volatility and Momentum portfolios were highly concentrated given that they represent only 5% of the stocks in the universe. (see here for why concentration can lead to higher expected returns) The portfolios exhibited a relatively low correlation of 0.49 over the last 30 years and even periods of negative correlation, which provided attractive diversification benefits.
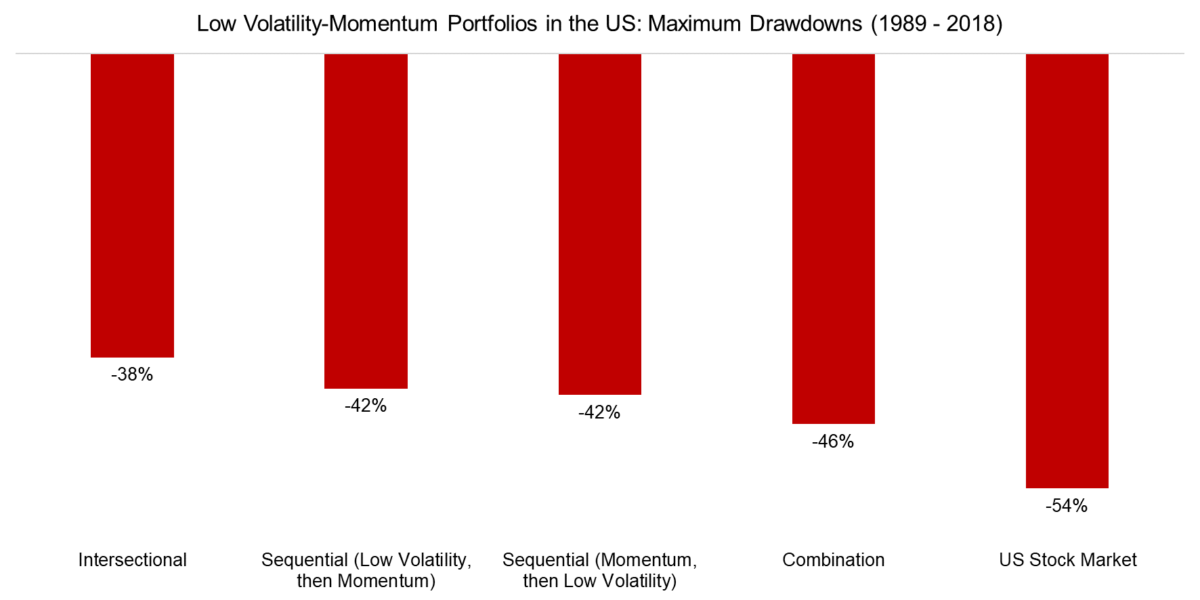
Investors primarily allocate to Low Volatility strategies for reducing equity risk and expect lower volatility and drawdowns. The worst point in the US stock market in the last three decades was reached during the global financial crisis in 2009, where LOVM portfolios experienced significantly lower drawdowns than the stock market.
Investors familiar with factor performance might be surprised by the reduced drawdowns given that the long-short Momentum factor crashed in 2009. However, the factor crashed only when stock markets started recovering and most of the negative excess returns can be attributed to the short portfolio.
BREAKDOWN BY SECTORS
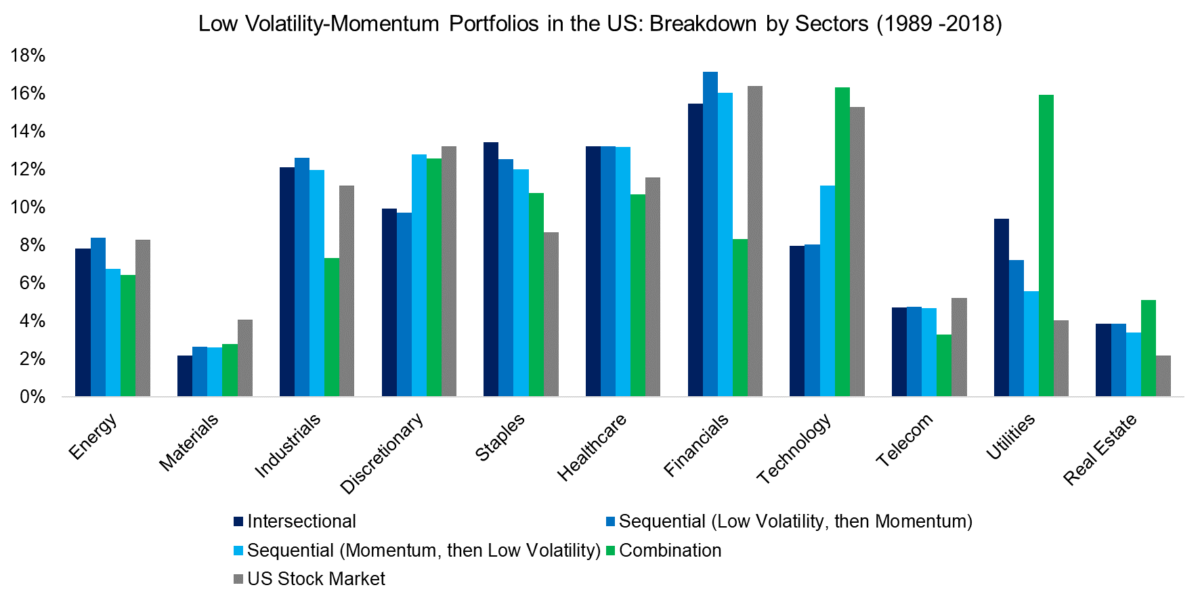
Next, we analyze the LOVM portfolios by sectors, which highlights significant differences to the US stock market. Broadly-speaking the portfolios created via the Intersectional and Sequential models were comparable and featured overweights in staples, utilities, and real estate as well as underweights in materials and technology.
In contrast, the Combination portfolio was more differentiated and exhibited a significant overweight to the utility and an underweight to the financial sector, which can be attributed to the Low Volatility respectively Momentum factor.
VALUATION OF LOVM PORTFOLIOS
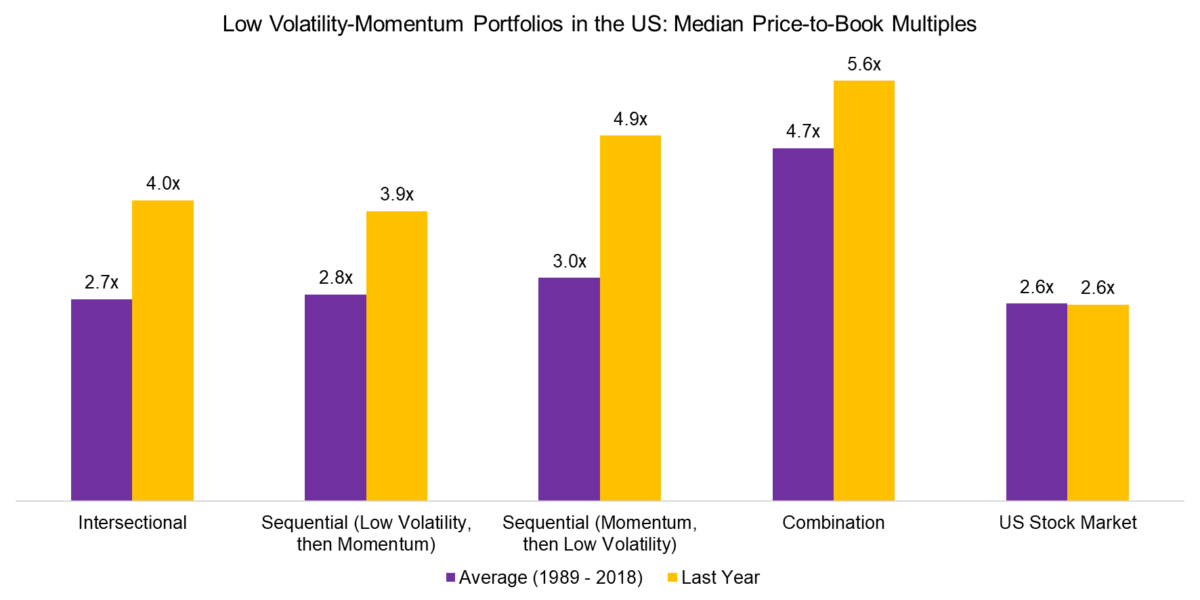
Finally, we investigate how the valuation of LOVM portfolios has changed over time. We observe that all portfolios are trading significantly more expensive than their 30-year average as well as the stock market when measuring the valuation with median price-to-book multiples.
It is interesting to note that most of the multiple expansion is from the Momentum and not the Low Volatility factor. Investors are frequently concerned that low-risk stocks have become expensive as many of these are from bond-proxy sectors like real estate or utilities, which benefitted from decreasing interest rates. Although these have increased in valuation compared to their historical average, it is currently far less then Momentum stocks, which include a meaningful amount of expensive technology firms.
FURTHER THOUGHTS
Given the attractive absolute and risk-adjusted returns of LOVM portfolios, it is surprising that currently there is no ETF on the market that offers this strategy. (1)
However, investors intrigued by the strategy might question if they should be wary of performance chasing. And as Larry Swedroe (a regular contributor to the Alpha Architect blog) always points out, it would be ideal to test this across markets and times to confirm that this multi-factor approach is indeed robust. Aside from perhaps being less emotionally painful to hold than other factor combinations, there are few arguments for why this multi-factor portfolio is superior to others such as a Value-Momentum combination. (although some research argues that low-volatility is simply a manifestation of value and momentum).

About the Author: Nicolas Rabener
—
Important Disclosures
For informational and educational purposes only and should not be construed as specific investment, accounting, legal, or tax advice. Certain information is deemed to be reliable, but its accuracy and completeness cannot be guaranteed. Third party information may become outdated or otherwise superseded without notice. Neither the Securities and Exchange Commission (SEC) nor any other federal or state agency has approved, determined the accuracy, or confirmed the adequacy of this article.
The views and opinions expressed herein are those of the author and do not necessarily reflect the views of Alpha Architect, its affiliates or its employees. Our full disclosures are available here. Definitions of common statistics used in our analysis are available here (towards the bottom).
Join thousands of other readers and subscribe to our blog.