The volume of work that has been done on insider transactions is not inconsequential, we’ve covered a variety of research on the topic in several blog posts just a few of which are here and here. This is the first time we observe corporate insider’s ability to overcome biases as an indicator of future returns though. Because corporate insiders are also human, they too can be subject to well-documented biases (such as anchoring), which can lead to behavioral errors and poor returns. “Anchoring bias” refers to the systematic bias induced by the anchoring heuristic (problem-solving method)—humans make decisions based on reference points, or anchors, they have experienced in the past. For example, the 2002 study “What Makes Investors Trade?” found that both retail and institutional investors exhibit anchoring bias in that they are more likely to sell stocks trading at a historical high and buy stocks trading at a historic low. The 2012 study “The Effect of Reference Point Prices on Mergers and Acquisitions” found that target shareholders are substantially more likely to accept takeover offers if such offers are made above the target firm’s 52-week high. And the 2017 study “Anchoring: The 52-Week High and Post Earnings Announcement Drift” found that anchoring on the 52-week high is what drives the market’s underreaction to extreme earnings news for individual stocks. On the other hand, insiders also have access to private information that might help them overcome such biases.
Ruihai Li, Wesley Wang, Zhipeng Yan, and Qunzi Zhang contribute to the literature on insider trading with their study “Trading Against the Grain: When Insiders Buy High and Sell Low,” which appeared in the November 2019 issue of The Journal of Portfolio Management. They used a comprehensive insider trading database covering the period 1986 to 2017. They began by noting that over the last three decades, the total dollar amount of shares U.S. corporate insiders have traded equals almost $1 trillion.
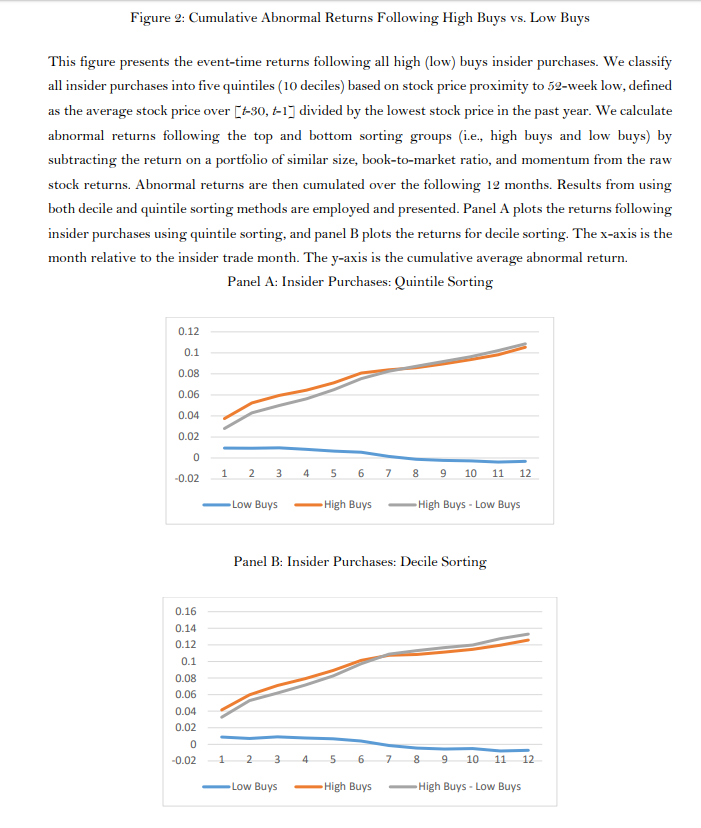
The authors sorted all insider trades into five quintiles based on the stock price’s nearness to its 52-week high. The stock price’s nearness is defined as the closing price averaged over the 30-day window before each insider transaction date divided by the 52-week high. For each quintile, they calculated the fraction of insider purchases as a percentage of the total insider trades. Insider trading activities were measured along three alternative dimensions: the number of purchases and sales, the total number of shares bought and sold, and the total dollar volume bought and sold. In the absence of the anchoring bias, the fraction of insider purchases as a percentage of total insider trades should remain relatively constant when the stock price falls into different quintiles. The existence of the anchoring bias would imply that the percentage of insider purchases should decrease (increase) as the stock price moves closer to its 52-week high (low). Following is a summary of their findings:
- Demonstrating anchoring bias, insider purchases as a percentage of all insider trades decrease almost monotonically as the stock price moves from far below the 52-week high to very close to the 52-week high. This pattern is robust to various measures of insider trading activity. The same anchoring bias was found in insider sales.
- Insider trades made when stock prices are far from their anchor levels are more informative—when insiders trade against their anchoring bias, it’s private information that is providing the catalyst to overcome it. Purchases (sales) far from anchoring levels are made because private information is positive (negative).
- Returns are more negative following low sales than high sales, and returns are more positive following high buys than low buys. Since insider trades are public knowledge (since 2002, all insiders are required to report their trades within two business days after the transaction date), outside investors can reap abnormal returns by piggybacking on insiders who make these buy-high, sell-low trades because purchases (sales) made far above (below) the anchoring price provide abnormal returns.
- Consistent with prior literature findings that insider purchases are more informative than sales (sales can be made simply for diversification purposes), the return difference is more pronounced for insider purchases than for insider sales.
- Subsequent 30-day stock returns following high buys using decile sorting are at least 3.3 percent higher than low buys. In contrast, the subsequent 30-day stock returns following low sells are at least 1.0 percent lower than high sells. A long-short trading strategy—buy high and sell low—based on these findings generates an average monthly abnormal return of around 2 percent before transaction costs.
- Results were highly significant and supported by various tests of robustness.
Their findings led Li, Wang, Yan and Zhang to conclude that the popular conventional wisdom of buying low and selling high makes investors, including insiders, easily subject to the anchoring bias. However, insiders also possess private information about their firms, which allows them to mitigate anchoring bias. Their main contribution was to demonstrate when insider trades are most informative. When the stock price is far from its anchor level, stocks have more positive returns following insider purchases and more negative returns following insider sales. This is consistent with the notion that, in these cases, insiders have overcome their anchoring bias through their access to positive and negative private information and trade precisely when the anchoring bias would suggest otherwise. Prior research supports the above findings.
Further Evidence
In their November 2018 study “Do Insiders Exploit Anomalies?” authors Deniz Anginer, Gerard Hoberg and Nejat Seyhun noted that research has demonstrated that “insiders can also accurately identify times when their own firm’s common stock becomes over- or underpriced and they trade to exploit such mispricing. Insiders buy before an abnormal stock price increase and sell before an abnormal stock price decline. Such trading can improve price efficiency and create large positive externalities in the form of price efficiency and resource allocation if the required disclosure of insider trades can be used by sophisticated anomaly traders to speed price corrections.”
Summary
Findings such as these demonstrate that while the markets are highly efficient, they are not perfectly so. If markets were perfectly efficient, insider trades far from anchoring prices would produce the same results as those that were close to them. It will be interesting to see if mutual funds incorporate this information into their fund construction and trading rules. For example, if a fund that uses systematic rules finds that a stock in its eligible buy universe has insiders selling at low prices, it could delay buying. The negative screen would work in the same way a small-cap fund would avoid buying a stock that falls into its market cap buy range but is exhibiting negative momentum. That would cause it to delay buying until the negative momentum ceases. Similarly, if the small-cap fund had a stock enter its sell range (it became too large) but has insider buys at high prices, it could delay selling (just as it might delay selling if the stock was exhibiting positive momentum).

About the Author: Larry Swedroe
—
Important Disclosures
For informational and educational purposes only and should not be construed as specific investment, accounting, legal, or tax advice. Certain information is deemed to be reliable, but its accuracy and completeness cannot be guaranteed. Third party information may become outdated or otherwise superseded without notice. Neither the Securities and Exchange Commission (SEC) nor any other federal or state agency has approved, determined the accuracy, or confirmed the adequacy of this article.
The views and opinions expressed herein are those of the author and do not necessarily reflect the views of Alpha Architect, its affiliates or its employees. Our full disclosures are available here. Definitions of common statistics used in our analysis are available here (towards the bottom).
Join thousands of other readers and subscribe to our blog.