- Richard D.F. Harris , Linh H. Nguyen and Evarist Stoja
- Journal of International Financial Markets, Institutions, and Money, 2019
- A version of this paper can be found here
- Want to read our summaries of academic finance papers? Check out our Academic Research Insight category
What are the Research Questions
Larry Swedroe recently wrote a post titled “Is there a Tail Risk Premium in Stocks.” This post is a good complement to Larry’s as this paper proposes two new measures of systematic tail risk and explores whether they are associated with a significant risk premium. The first measure, Extreme Downside Correlation (EDC), is based on the tendency of stock returns to crash at the same time as the market, while the second, Extreme Downside Hedge (EDH), is based on the sensitivity of stock returns to market tail risk.
What are the Academic Insights?
The authors analyze daily data on stocks in the NYSE, AMEX and NASDAQ markets from 1968 to 2017. They utilize this data and organize the stocks into quintiles based on each risk measure and calculating the equally weighted excess returns of these quintiles for the same year. They also calculate the return of a long-short strategy which takes a long position in portfolio 5 (the quintile with the highest risk measure) and a short position in portfolio 1 (the quintile with the lowest risk measure).
They find the following:
- There is a significant positive relationship between systematic tail risk and average returns using both risk measures. Specifically, the average excess return increases almost monotonically from quintile 1 to quintile 5.
- The average excess return of quintile 5 is more than double that of quintile 1 in the case of EDC (21.6 percent annually compared with 10.6 percent annually). As a result, the returns from the long-short strategies are highly positive, even after controlling for the Fama-French-Carhart risk factors. The significant alphas suggest that the excess returns of the long-short strategy cannot be explained by the classic market, size, book-to-market and momentum factors.
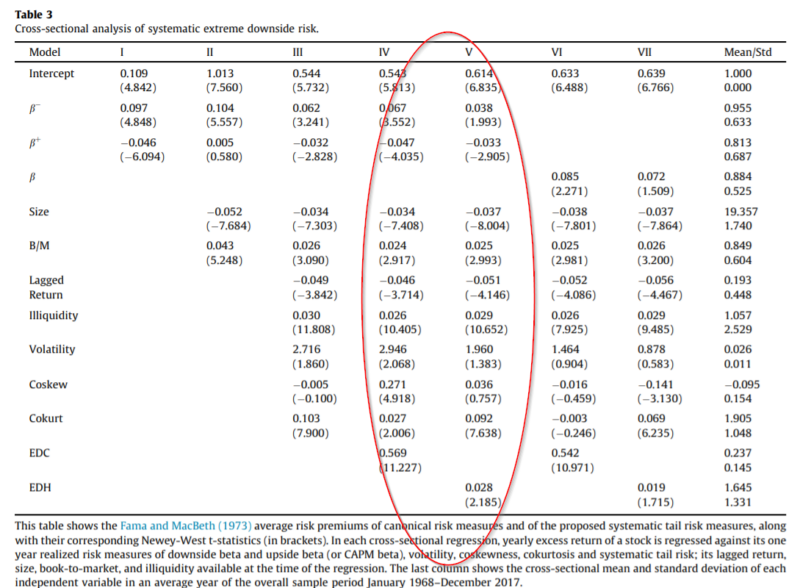
Additionally, the difference between the average returns of stocks with different exposure to systematic tail risk might be explained by other factors such as general downside risk or illiquidity, among others. Thus, in order to capture the net effect of systematic tail risk on returns accounting for other risk factors, the authors undertake a Fama and MacBeth (1973) crosssectional regression analysis.
The results are as follows:
- A positive and statistically significant relationship between tail risk and average returns for both measures.
- The magnitude of relationship between systematic tail risk and return, as measured by the change in expected return corresponding to one standard deviation change in the risk measure, is economically larger than that of other classical risk measures. Specifically, a one standard deviation change in EDC and EDH increases expected returns by 8.3 percent and 3.7 percent, respectively.
The authors perform a series of robustness tests ( different measures of tail risk, different estimation methods and different cut-off thresholds for the tail of the return distribution).
Why does it matter?
This study introduces two new systematic tail risk measures (something that would have been useful in February, but is still useful now!). Using both measures, the authors find evidence of a significantly positive tail risk premium. The measures also have significant predictive power for future returns. One possible application for future research is to examine the pricing information in truly idiosyncratic tail risk.
The Most Important Chart from the Paper:
The results are hypothetical results and are NOT an indicator of future results and do NOT represent returns that any investor actually attained. Indexes are unmanaged and do not reflect management or trading fees, and one cannot invest directly in an index.
Abstract
We propose new systematic tail risk measures constructed using two different approaches. The first is a non-parametric measure that captures the tendency of a stock to crash at the same time as the market, while the second is based on the sensitivity of stock returns to innovations in market crash risk. Both tail risk measures are associated with a significantly positive risk premium after controlling for other measures of downside risk, including downside beta, coskewness and cokurtosis. Using the new measures, we examine the relevance for investors of the tail risk premium over different horizons.

About the Author: Wesley Gray, PhD
—
Important Disclosures
For informational and educational purposes only and should not be construed as specific investment, accounting, legal, or tax advice. Certain information is deemed to be reliable, but its accuracy and completeness cannot be guaranteed. Third party information may become outdated or otherwise superseded without notice. Neither the Securities and Exchange Commission (SEC) nor any other federal or state agency has approved, determined the accuracy, or confirmed the adequacy of this article.
The views and opinions expressed herein are those of the author and do not necessarily reflect the views of Alpha Architect, its affiliates or its employees. Our full disclosures are available here. Definitions of common statistics used in our analysis are available here (towards the bottom).
Join thousands of other readers and subscribe to our blog.