” It is often said there are two types of forecasts … lucky or wrong!!!! “-“Control” magazine published by Institute of Operations Management
There is little question that the stock market has been acting a bit like a three-year-old consisting of temper tantrums and sugar highs. In a world, with such great volatility, it might be a good idea to sit down, take a measure of the data being presented, and set yourself up with some semblance of a guess as to what the market might actually be worth. On February 25th Aswath Damodaran took his first stab at analyzing the impacts of the Coronavirus putting some numbers into a model to see just where he thought things might go. I’ve used his work, which you can find here, as the basis for doing this 2 months later in late April(1).
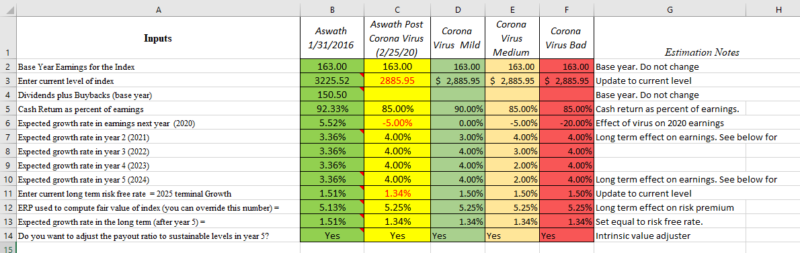
Aswath’s model is a fairly straightforward dividend discount model on the entire S&P 500 the image below is a quick glimpse.
Digging in to the valuation model
Now that we’ve gotten a chance to take a quick look, let’s review the inputs into the model, and how we considered adjusting them when needed.
- Base Year Earnings for the index.
- Aswath gave us base earnings for the S&P 500 at $163.00/Share.
- We made no adjustments to this
- Current Index level
- At the time of his first posting (2/25/20) Aswath had an index price of 3128.21
- When we ran the model the S&P 500 was trading at $2885.95.
- Dividends and Buybacks base year
- This is simply the “cash returned” to shareholders via dividends and buybacks in 2019
- Cash return as a percentage of earnings(2)
- As of the end of 2019, the S&P 500 was pushing out 92.33% of all earnings in the form of dividends and share buybacks
- Aswath took the lead and assumed that corporations would get more conservative with distributing earnings and moved his estimate down to 85%.
- I followed his lead and assumed that in anything but the best-case scenario cash returned to shareholders would be paired back to 85%. My best-case scenario estimated a slight slowdown in payouts to 90% of earnings.
- Expected growth rate impact COV-19 will have on 2020
- You can see that even early in the process Aswath was predicting a 5% slowdown in earnings.
- I tried my best to temper an ingrown weakness I have of being overly conservative. Therefore my optimal outcome was that growth would be slow early in the year, but all the lost purchases would come back strong in the second half of the year leaving us with no growth for 2020. My medium case had growth at -5% for the year, and my worst-case scenario had earnings growth of -20% for the year. Considering that many industries have been all but shutting down for roughly 20% of the year, this doesn’t seem so extreme to me.
- Expected growth rates for 2021 – 2024
- Aswath did not separate these out into individual years. He instead estimated how much of the drop in earnings caused by 2020 would be recouped by 2024, then used a growth rate that would net him the final total earnings. You can see his chart here. His estimate was 4%.
- Too much detail in a model can sometimes be unnecessary, but in this case, I like having the ability to adjust for the first year possibly having a higher growth rate than the following years. As there could be a significant bounce-back of purchases and therefore earnings that were delayed because of the virus. In some cases, those increased earnings could continue for more than the first year. Which is why I thought it would be useful to have the ability to adjust each year individually.
- Equity Risk Premium (ERP)
- Prof. Damodaran felt that investors would increase the ERP slightly to reflect the increased risk in equity markets
- We stuck with his estimate of the ERP, and made no adjustments here. Though after the volatility the market experienced throughout March and the VIX remaining at elevated, though falling, levels the ERP may be higher today and remain so for an extended period of time.
- Long term risk-free rate:
- Aswath had a long term risk free rate at 1.51% at the beginning of the year, and when he initially did his work on this he slightly adjusted his risk free rate down to 1.34%
- Arguably one could make the discount rate even lower than 1.34% as rates have continued to soften. However, in my model, I stuck with Aswath’s estimate of the long term risk-free rate. Maybe I am letting my “conservative” bias out here a little bit.
Estimating Fair Value using Aswath’s tool
There are four critical estimates that have been impacted by the coronavirus.
The four questions we all need to ask and estimate are as follows:
- How materially will earnings growth be impacted in 2020 and how long those impacts will linger in the market?
- How will companies react to the virus specifically how they view distributing cash to investors?
- Will investors require a higher Equity Risk Premium going forward to discount the increased risk in the market?
- How will the risk-free rate be impacted?
So with all this said here we peak through my very biased very human crystal ball. On the left under the blue heading you’ll Prof. Aswath’s estimates, and under the yellow headline you’ll see mine:
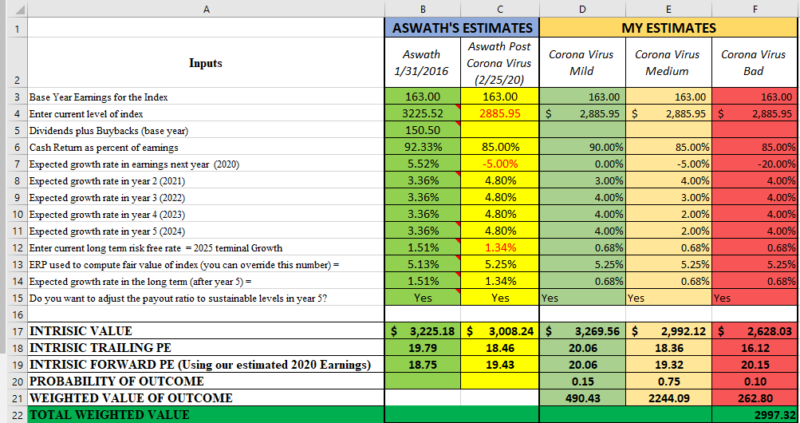
I added a bit more estimating by weighting each of my outcomes, with what admit is nothing more than a wild guess. When I weight each outcome with a probability of 15% chance of a very mild impact due to Corona Virus, 75% chance of a reasonable impact, and finally a 10% chance of the worst-case scenario. With those estimates, I get a rough estimate of the Intrinsic Value of the S&P 500 at just under 3000.
This I admit, surprised me. My internal wild guess barometer would have put it much much lower. So this exercise allowed me to slide my wild guess a bit higher than I would have previously done. However, as most readers will know, when you start playing with any discounted cash flow model, you’ll soon realize just how material an impact the discount rate has on valuation. If you take a quick look at the first image you’ll notice that I initially ran this with Aswath’s long term risk-free rates. Dropping Prof. Damodaran’s discount rate by roughly 50% to today’s 10-year yield (a mind-bendingly low 0.68%) has a very substantial impact on the intrinsic value of the index. The massive reaction(3) in the fixed income market and the impact on long term borrowing rates has been outstanding and has significantly moved valuations upward even with lower earnings potential.
I am but one very flawed prognosticator. We’d love more estimates and more data inputs from the community. If you feel differently I encourage you to make your own estimates and we can compile the results, the more estimates we get the more accurate our model is likely to get.

References[+]
| ↑1 | It’s now June and the market has done some amazing things since I first wrote the post, recovering significantly faster than I’d have thought possible. |
|---|---|
| ↑2 | Adjustments here have material impacts on the outcome as the model is using these distributions as the cash flows we are discounting |
| ↑3 | Or Fed manipulation |
About the Author: Rich Shaner, CFA
—
Important Disclosures
For informational and educational purposes only and should not be construed as specific investment, accounting, legal, or tax advice. Certain information is deemed to be reliable, but its accuracy and completeness cannot be guaranteed. Third party information may become outdated or otherwise superseded without notice. Neither the Securities and Exchange Commission (SEC) nor any other federal or state agency has approved, determined the accuracy, or confirmed the adequacy of this article.
The views and opinions expressed herein are those of the author and do not necessarily reflect the views of Alpha Architect, its affiliates or its employees. Our full disclosures are available here. Definitions of common statistics used in our analysis are available here (towards the bottom).
Join thousands of other readers and subscribe to our blog.