Enhanced Portfolio Optimization
- Lasse Heje Pedersen, Abhilash Babu, and Ari Levine
- Working Paper, SSRN
- A version of this paper can be found here
- Want to read our summaries of academic finance papers? Check out our Academic Research Insight category
What are the research questions?
As a general rule, we recommend you kick your spidey senses into high gear anytime there is a geek bearing formulas (especially if they are trying to sell you something). Simple is always a nice cheap default because complexity often leads to confusion, which leans to a need to have an expert, which leads to advice fees, and so the game goes. With that disclosure out of the way, complexity is not always a bad thing and researchers have been trying to get mean-variance optimization to add value for a long time. The concept is simply too elegant to ignore, but the problem is that the complexity of these models is generally ruined by “noisy” inputs (e.g., covariance matrix) that lead to garbage in = garbage out issues.
In this piece, the authors attempt to identify “problem portfolios” typically encountered strictly within the mean-variance-optimization (MVO) framework, and secondarily, how to fix these issues.(1)
Here are the key elements of the paper:
- What are the “problem” portfolios associated with MVO?
- How does enhanced portfolio optimization (EPO) address those issues?
- How well does the EPO fix work?
What are the Academic Insights?
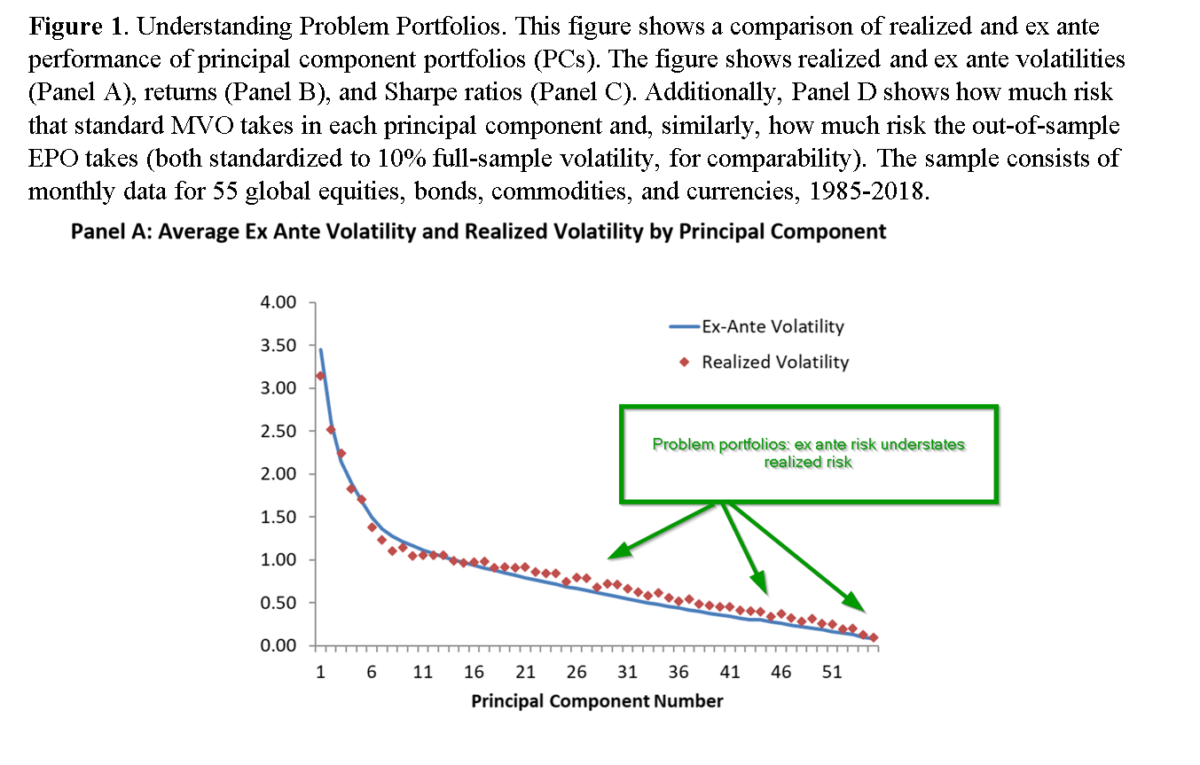
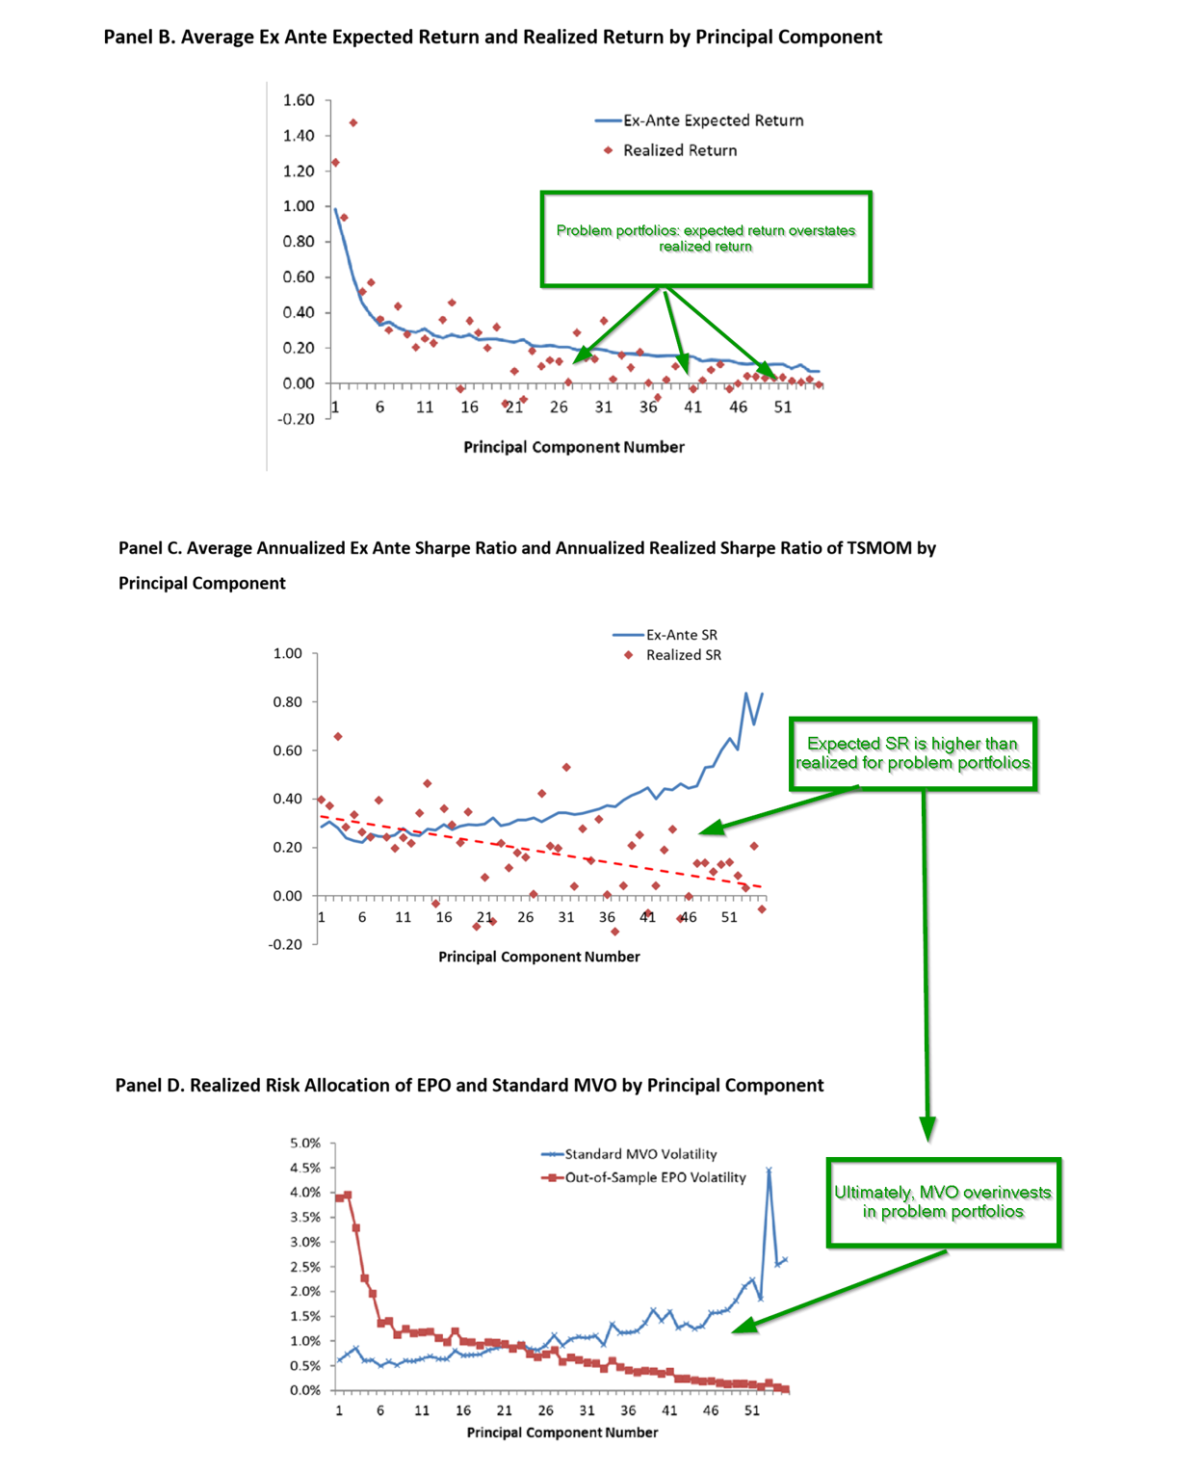
- Noisy data. The authors illustrate the problems that arise from MVO by applying principal components analysis to the correlation matrix for a set of 55 global equities, bonds, commodities, and currencies. The authors transform the standard mean-variance optimization problem into the framework of principal components (PC), essentially constructing long-short portfolios that are uncorrelated with each other and ranked by risk as the relevant measure of importance. The first PC is the riskiest portfolio, the second PC is the next riskiest independent of the first PC, and so on. The last set of PCs are the least risky portfolios although not necessarily those with the lowest expected returns nor with the lowest estimation error. Turns out the last of PC portfolios correspond to the problem portfolios for MVO as they are the most attractive on an expected return to risk basis. Panels A and B of Figure 1 plot the variance of all PC portfolios, where PC #1 has the largest ex-ante variance which then declines as the number of PC portfolios increases. Given that the expected risk understates the actual risk level while the expected return overstates the actual, we see in Panel C that the expected Sharpe Ratio (SR) overstates the actual performance for the problem portfolios. The behavior illustrated in Panels A and B interact with one another in a decidedly non-optimal manner. Panel C shows a dramatic difference between the expected and realized SR. The higher risk (low numbered) PCs have lower expected SRs than lower risk (high numbered) PCs. Obviously, the expected SR is higher because the risk is underestimated for high numbered PCs and expected return is overestimated for these undesirable portfolios. The question is why? The authors speculate that this difference is due to the importance of economic factors driving low numbered PCs, while drivers of high numbered PCs are deemed “unintuitive”.
- Shrinkage. The EPO adjustment is described in detail in the article, but is basically a modification of expected variance and expected return such that estimation uncertainty is reduced. The implementation of EPO is then the same as for MVO while improving the behavior of the optimization. The problem portfolios (higher numbered PCs) are not given too much weight. The idea is to provide a shrinkage parameter to reduce all correlations toward zero and to maximize the SR as the optimization objective. The shrinkage parameter turns out to be fairly large and provides a large performance improvement. The key insight from this research is to recognize that shrinking the SR ensures that errors in correlations and expected returns are addressed. So how much shrinkage is necessary or sufficient to fix the issue? The authors approach this as an empirical question and conclude that 50% is a useful target. They explain: “To “fix” the correlation matrix, we typically need to shrink the correlation matrix only about 5% to 10%. So why do we need a much larger shrinkage of around 50%? As explained above, we show theoretically that errors in the estimates of expected returns also make correlation shrinkage useful, and the errors in return estimation may be much larger than the errors in the correlation matrix itself. We find strong optimization improvements when we use a surprisingly large amount of shrinkage (surprising from the perspective of what is needed to fix the correlation matrix from a pure risk perspective). “
- VERY WELL. The impact of shrinking correlations results in an increase in the risk of high-numbered (the least important) PCs. A comparison of MVO to EPO is presented in Panel D. Standard MVO invests in more of the problem portfolios than EPO does. The allocation to realized high-risk PCs is much lower when the enhancement is applied. The authors apply EPO to a variety of securities, benchmarks, weighting schemes, and strategies, including global assets, time-series momentum, industry momentum, equally weighted, and volatility-scaled portfolios. In each case, the EPO methodology outperformed and was unexplained by commonly accepted factor models, such as Fama-French factors.
Why does it matter?
In principle, MVO is the ultimate tool for building efficient portfolios. However, in practice, MVO performs poorly under most circumstances. However, this paper provides a coherent and intuitive explanation of an enhanced approach that reduces the estimation errors responsible for the failure of MVO. Using principal components, the authors illustrate that the standard MVO method takes large positions in “problematic” portfolios that fail to produce the expected superior performance on an out-of-sample basis. Based on that observation, they develop an analytical argument and rigorously test EPO and provide convincing evidence that the shrinkage enhancement to MVO is an attractive and simple alternative.
The most important chart from the paper


Abstract
We show how to identify the portfolios that cause problems in standard mean-variance optimization (MVO) and develop an enhanced portfolio optimization (EPO) method that addresses the problems. The EPO solution encompasses existing methods such as standard MVO, reverse-MVO, a Bayesian estimator, Black-Litterman, robust optimization, a form of generalized ridge regression used in machine learning, and random matrix theory. Nevertheless, the closed-form EPO is extremely simple. Applying EPO on several realistic datasets, we find significant gains relative to standard benchmarks. In equities, EPO significantly outperforms the market, the 1/N portfolio, and standard asset pricing factors. Similarly in global asset allocation, EPO delivers economically significant increases in the Sharpe ratio and statistically significant alpha to standard time series momentum strategies and other benchmarks.
About the Author: Tommi Johnsen, PhD
—
Important Disclosures
For informational and educational purposes only and should not be construed as specific investment, accounting, legal, or tax advice. Certain information is deemed to be reliable, but its accuracy and completeness cannot be guaranteed. Third party information may become outdated or otherwise superseded without notice. Neither the Securities and Exchange Commission (SEC) nor any other federal or state agency has approved, determined the accuracy, or confirmed the adequacy of this article.
The views and opinions expressed herein are those of the author and do not necessarily reflect the views of Alpha Architect, its affiliates or its employees. Our full disclosures are available here. Definitions of common statistics used in our analysis are available here (towards the bottom).
Join thousands of other readers and subscribe to our blog.

