Editor’s Note: The ability of value investors to adhere to their investment strategy has been put to the greatest test ever. From January 2017 through March 2020, in terms of total returns, the Russell 3000 Growth Index outperformed the Russell 3000 Value Index by 51.7 percentage points (46.7% vs. -5.0%). That drawdown was much greater than previous ones and has lasted longer. For frequent readers of the blog, we’ve made this dirty little secret fairly obvious. A quick search of our inventory of articles turns out a bevy of results, including “Is Systematic Value Dead???,” “Is value dead? Has the story changed? No,” “Is There Something Wrong with the Value Premium?” and many more to keep you reading for days. Writing/reading about the realities of the value premium can help build our ability to stay disciplined (if an investor chooses to go down the value path). We hope this piece contributes to this cause.
Two of legendary investor Warren Buffett’s great contributions have been that he has taught investors to buy cheap, profitable companies and that he has preached the importance of patience and discipline, avoiding the noise of the market. He famously said, “Investing is simple, but not easy.” Or as Wes put it, “Even God Would Get Fired as an Active Investor.”
If his strategy of buying profitable value stocks is simple, why did he proclaim it is not easy? I believe it is because he understood that all strategies that invest in risky assets experience long periods of poor performance. And most investors are unable to withstand the stress created by such periods. At some point, the drawdown, whether it’s in absolute or relative terms, becomes large enough that it causes investors to reach what I call their “GMO” point—the point where their stomach screams, “Get me out!” That leads to the loss of discipline and panic selling, which is why Buffett has advised investors: “If they insist on trying to time their participation in equities, they should try to be fearful when others are greedy and greedy only when others are fearful.” In other words, buy after long periods of underperformance and sell after periods of outperformance! Unfortunately, that is exactly the opposite of what so many investors do.
Examining the historical evidence on drawdowns demonstrates how important it is to stay disciplined, adhering to your investment strategy. As you review the evidence, keep in mind Buffett’s warning about trying to time the market. And remember that if active managers were able to time their exits and entrees, we would see persistent evidence of their ability to outperform. However, we don’t have any such evidence. We’ll begin by reviewing the evidence on the riskiness of equities.
To appreciate the riskiness of equity investing, consider that while from 1926 through July 2020 the S&P 500 Index returned 10.2% per year, it did so while experiencing volatility of 18.7%. In addition, it experienced six crashes of at least 33%:
- September 1929-June 1932 (loss of 83.2%).
- April 1937-March 1938 (loss of 49.7%)
- January 1973-September 1974 (loss of 42.6%).
- March 2000-September 2002 (loss of 38.3%).
- June 2007-February 2009 (loss of 50.0%).
- February 4, 2020-March 23, 2020 (loss of 33.8%).
Since most investors are risk-averse, the potential for such great losses explains why the equity risk premium (market beta) has been in excess of an annual average of 8% a year since 1926—investors require a large risk premium to accept the risks of large losses. And there have been three periods of at least 13 years when the S&P 500 Index underperformed riskless one-month Treasuries (1929-43, 1966-82 and 2000-12). In other words, in order to earn that 10.2% return, investors had to stay disciplined, avoiding panicked selling during market crashes and enduring periods as long as 17 years of underperformance.
Having seen that the S&P 500 experienced six drawdowns of at least 33% and underperformed for three periods of at least 13 years, we now turn to examine the evidence on individual stocks. Hendrik Bessembinder contributes to the literature on the riskiness of stocks, and individual stocks in particular, with his July 2020 study “Extreme Stock Market Performers, Part I: Expect Some Drawdowns.” This study, in which he examined the performance of the 100 most successful stocks/decades in terms of shareholder wealth creation, was a follow-up to his 2018 study “Do Stocks Outperform Treasury Bills?” Among his findings from the prior paper was that even at the decade horizon, a minority of stocks outperformed Treasury bills and less than 4% of single-stock strategies produced a holding period return greater than the value-weighted market. The results showed how risky individual stock ownership is, and why diversification is the investor’s best friend. It also demonstrated how tempting it is to try to find those superstar stocks. It also helps explain why growth stocks have underperformed value stocks over the long term—investors seek out those few winning “lottery tickets,” causing their valuations to become excessive. Thus, the stocks earn lower returns.
Bessembinder’s new study covers the seven decades beginning in 1950. Following is a summary of his findings:
- Even the investments that created the most wealth for shareholders during a given decade experienced very substantive reversals along the way—within the highly successful decade, shareholders experienced drawdowns that lasted an average of 10 months and involved an average loss of 32.5%.
- During the immediately preceding decade, drawdowns for these highly successful stocks lasted an average of 22 months and involved an average cumulative loss of 51.6%—you had to stay the course, enduring those dramatic drawdowns to make sure you were still there to experience the great returns.
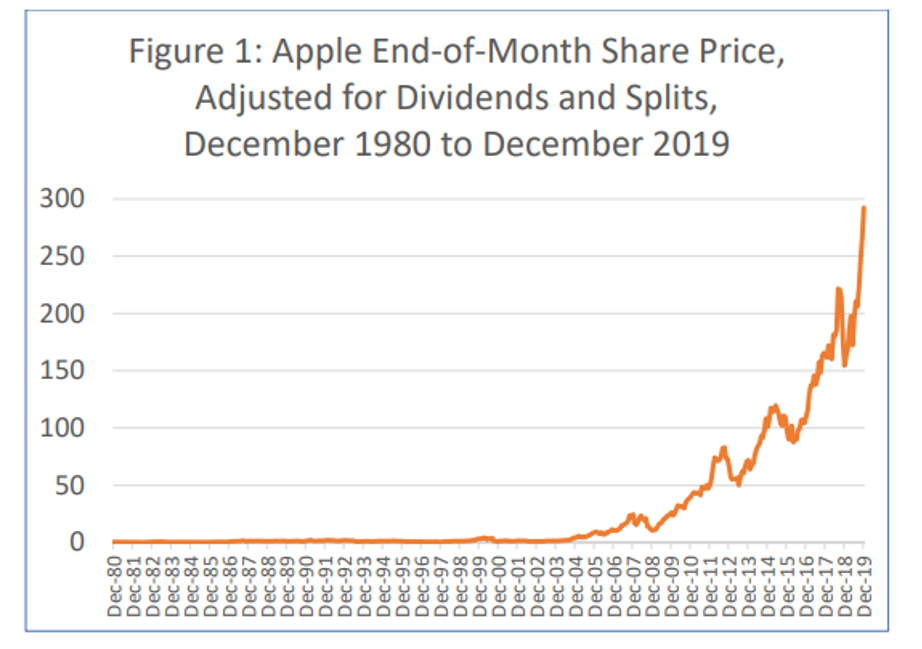
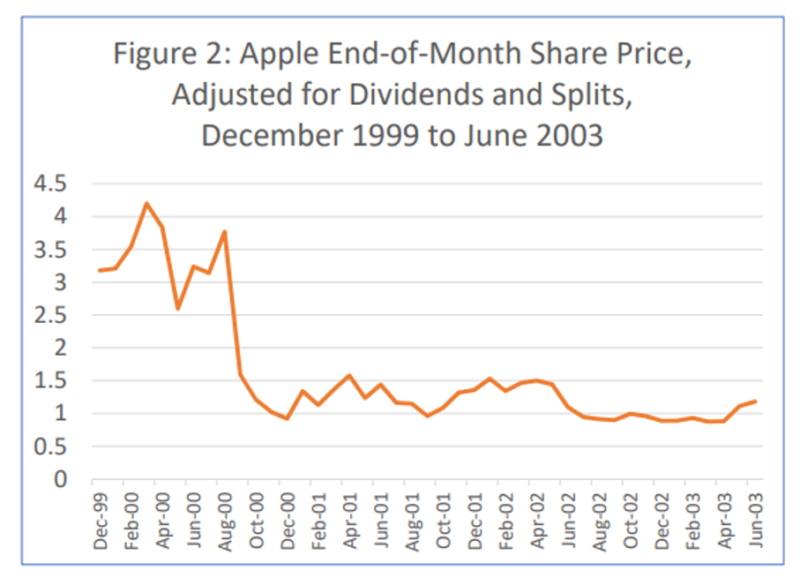
As a striking example, he presented the case of Apple (AAPL), which generated $1.64 trillion in shareholder wealth between January 1981 and December 2019, more than any other publicly-traded U.S. firm since 1926. Of this total, $1.47 trillion accrued during the most recent (2010-2019) decade. However, on no less than three occasions, Apple shareholders experienced drawdowns that exceeded 70%. These included a drawdown of 74.0% from May 1983 to August 1985, a drawdown of 79.7% from February 1992 to December 1997, and a drawdown of 79.2% from March 2000 to March 2003. Even in the most recent decade, during which Apple is at the top of the list, Apple shareholders endured a 39.5% drawdown between September 2012 and June 2013.
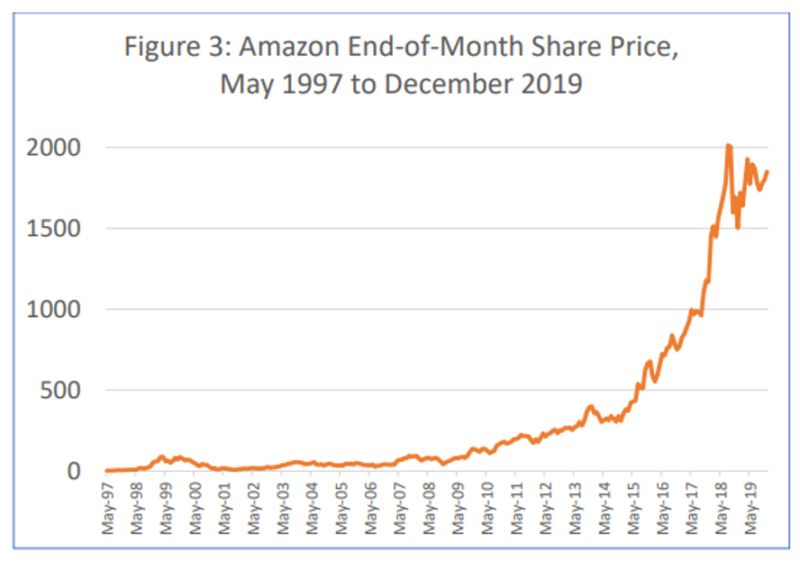
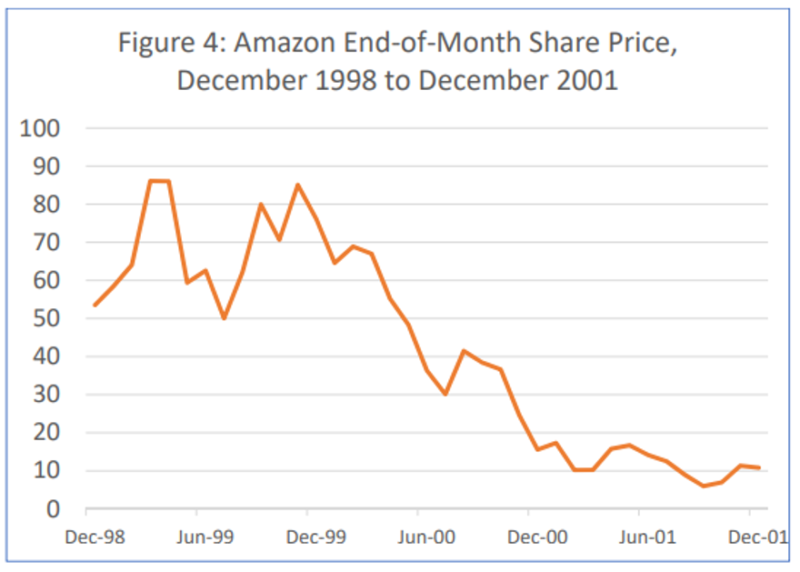
As another example, he cited the case of Amazon (AMZN). Between June 1997 and December 2019, equity investments in Amazon improved shareholder wealth by $865 billion, which is the fourth-highest total among the 26,168 firms that appear in the CRSP common stock database since 1926. Yet, between February 2000 and September 2001, Amazon shareholders experienced a drawdown of 91.3%. Bessimbinder also noted that while 56 of the 100 entries pertain to the most recent decade, General Motors, DuPont, Exxon Mobile, AT&T Corporation, General Electric and IBM all appear for wealth created during the 1950-59 decade. In other words, they were the FAANGs of their day.
Here are two more important examples, notable for the size of their drawdowns. Citigroup generated shareholder wealth of $137 billion during the most recent decade (69th on the list), but Citigroup shareholders endured a 97.0% drawdown from December 2006 to February 2009 of the prior decade. And EMC Corporation generated shareholder wealth of $149 billion during the 1990-1999 decade (56th on the list) but had an 87.5% drawdown from August 1987 to December 1989 of the prior decade.
Bessembinder concluded: “The most successful company investments in terms of wealth created for shareholders at the decade horizon also involved very substantial peak-to-trough drawdowns. Even those investments that are the most successful at long horizons typically involve painful losses over shorter horizons.” In other words, patience and discipline are required to achieve great returns.
Having reviewed the evidence on both the broad market in general, as represented by the S&P 500 Index, and individual stocks, we now turn to the evidence on drawdowns for the value premium. The historical evidence demonstrates that value investing has created wealth for disciplined investors for almost 100 years. We are looking to see if value’s drawdowns have been significantly different than those experienced by the broad market (the market beta premium) and individual stocks.
The Wild Ride of the Value Premium
- 1931-32 value drawdown was 30.8%.
- April 1937-May 1940 value drawdown was 36.4%.
- August 1979-November 1980 value drawdown was 28.3%.
- April 1989-December 1991 value drawdown was 25.0%.
- June 1998-March 2000 value drawdown was 36.6.
As you can see, the most recent drawdown of about 50% is only unusual in that it lasted a bit longer than any of the prior drawdown periods, and it was much deeper. That combination is what has created the greatest test of discipline value investors have ever faced. To help you stay disciplined, we can examine the evidence history provides on how value performed following those five prior drawdowns.
- After underperforming growth by 16.8% per annum (total drawdown of 30.8%) from 1931 through 1932, from 1933 through 1936 value outperformed growth by 14.1% per annum (total outperformance of 93.5%).
- After underperforming growth by 13.3% per annum (total drawdown of 36.4%) from April 1937 through May 1940, from June 1940 through December 1949 value outperformed growth by 10.7% per annum (total outperformance of 165.9%).
- After underperforming growth by 22.1% per annum (total drawdown of 28.3%) from August 1979 through November 1980, from December 1980 through December 1988 value outperformed growth by 10.7% per annum (total outperformance of 133.6%).
- After underperforming growth by 22.0% per annum (total drawdown of 36.6%) from June 1998 through March 2000, from April 2000 through December 2006 value outperformed growth by 14.2% per annum (total outperformance of 145.3%).(1)
In each case, patience and discipline were well rewarded. In addition, what investors should be aware of is that value’s recent underperformance is mostly explained by changing valuations—the expanding P/E ratios investors are willing to pay for growth stocks—and not a change in the “economic regime,” with the profitability of growth companies improving relative to that of value companies. The following charts show that while there has been some improvement in the relative profitability of U.S. large growth companies versus large value stocks, this has not been the case in either developed international markets or emerging markets, where growth stocks have also outperformed.
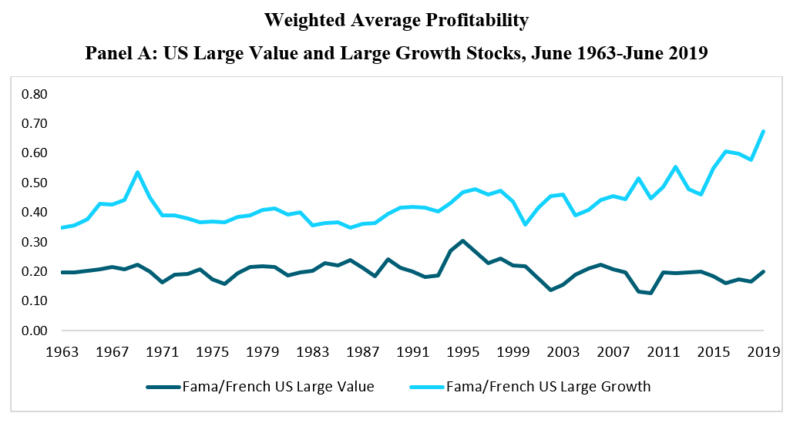
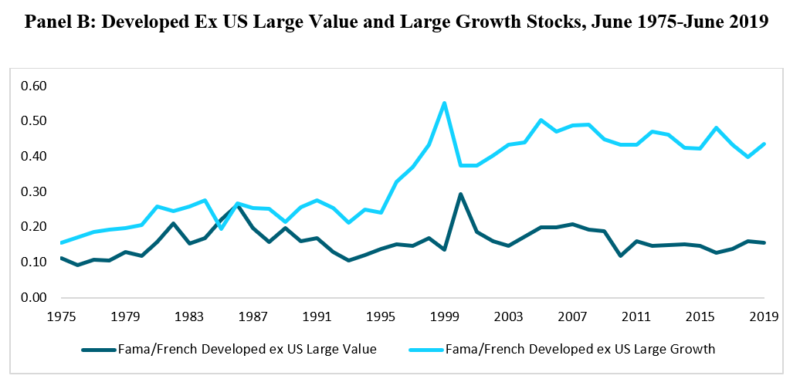
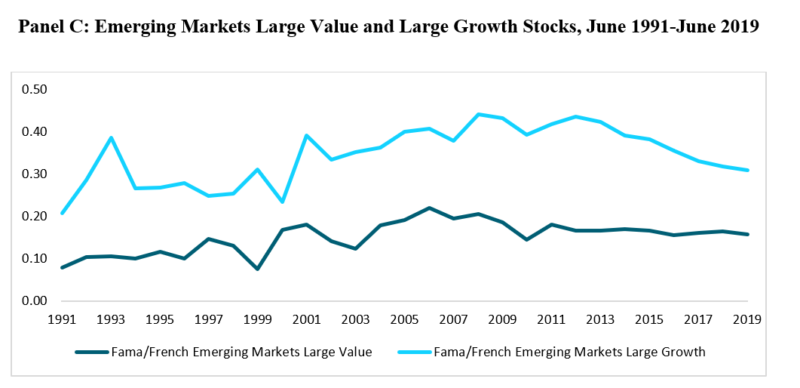
In USD. Source: CRSP, Compustat, and Bloomberg data calculated by Dimensional. Fama/French portfolios provided by Ken French Data Library. Profitability for June of year t is computed as operating income before depreciation and amortization minus interest expense scaled by book value for the last fiscal year-end in t-1. Weighted average profitability is the value-weighted average profitability based on June month-end market value. Eugene Fama and Ken French are members of the Board of Directors of the general partner of, and provide consulting services to, Dimensional Fund Advisors LP.
In other words, none of the assumptions behind a belief in the value premium should have changed. It’s just that investor willingness to pay for potential growth has increased, repeating the experience of the 1920s (the Roaring Twenties, when Westinghouse and RCA were the FAANGs of their day), the 1960s (the Nifty Fifty era, when Kodak, Polaroid, Xerox, and IBM were the FAANGs of their day), and the 1990s (the dot-com era). In addition, the dramatic drawdown has left the valuations of value stocks relative to growth stocks at the 100th percentile in the U.S. (the cheapest) and close to that in international and emerging markets. In other words, the ex-ante value premium is now much greater than the historical average. That said, it’s important to note that cheap can get cheaper and markets can remain irrational for a long time—which Alan Greenspan discovered when in December 1996 he declared the market to be exhibiting “irrational exuberance.” He was eventually right, but the market continued to defy him until the bubble finally burst in March 2000, more than three years later. That is why, when I am asked when the value premium will recover, my answer is always the same: My crystal ball is always cloudy. But that said, I caution that it will likely begin to recover the day after you lose discipline, give up and sell.
Summary
All strategies involving risk assets assume risk of failure, regardless of your investment horizon—there is no guarantee that you will ultimately be rewarded. If you doubt that, just ask investors in Japanese large-cap stocks, who from January 1990 through March 2020 earned no return, and that’s even before considering inflation (note that value stocks returned 3% per annum). That’s not a reason to avoid risk. It’s a reason to diversify, avoiding the concentration of assets in any one risk basket, because that basket just might be the one that experiences decades of underperformance. As mentioned earlier, the S&P 500 has experienced three periods of at least 13 years when it underperformed totally riskless Treasury bills—another example of why investing is simple, but not easy.
In my 25 years of advising both individual and institutional investors, the biggest mistake they make is thinking that when it comes to judging the performance of an investment strategy, three years is a long time, five years is a very long time, and 10 years is an eternity. That belief leads them to ignore long-term evidence and abandon well-thought-out plans in order to chase performance. The result is that they end up buying high (after periods of outperformance) and selling low (after periods of poor performance). Buying high and selling low is not a prescription for success. Yet, it is the path so many investors follow when they fail to pay attention to the lessons history has provided. To paraphrase Spanish philosopher Santayana: “Those who don’t know their investment history are condemned to repeat it.”
As Warren Buffett noted, when it comes to investing, once you have ordinary intelligence, temperament—the ability to ignore the noise of the market—trumps intellect. Do you have the discipline and patience to follow Buffett’s advice?

About the Author: Larry Swedroe
—
Important Disclosures
For informational and educational purposes only and should not be construed as specific investment, accounting, legal, or tax advice. Certain information is deemed to be reliable, but its accuracy and completeness cannot be guaranteed. Third party information may become outdated or otherwise superseded without notice. Neither the Securities and Exchange Commission (SEC) nor any other federal or state agency has approved, determined the accuracy, or confirmed the adequacy of this article.
The views and opinions expressed herein are those of the author and do not necessarily reflect the views of Alpha Architect, its affiliates or its employees. Our full disclosures are available here. Definitions of common statistics used in our analysis are available here (towards the bottom).
Join thousands of other readers and subscribe to our blog.