INTRODUCTION
The two basic rules of asset allocation are: i) identify assets with positive expected payoffs, and ii) ensure that the assets are not too highly correlated, so that diversification benefits can be harvested. Although the rules are simple, implementation is often complex.
Equities have a positive expected return over the long-term as stocks represent risk capital in for-profit companies. Bonds pay interest. However, the case is not so clear for some asset classes like commodities or currencies. Neither Gold nor Bitcoin generate cashflows and are mainly driven by market sentiment.
Similarly, when creating a multi-factor portfolio, an investor should select factors that are expected to generate positive excess returns and are not too highly correlated. A classic strategy would be to combine Value and Momentum, where research shows that these allow investors to outperform markets while being lowly correlated to each other as cheap stocks are typically not outperforming at the same time that the best-performing stocks tend to trade at expensive valuations.
In this short research note, we will analyze two-factor portfolios created by minimizing factor correlations.
METHODOLOGY
We focus on seven factors namely Value, Size, Momentum, Low Volatility, Quality, Growth, and Dividend Yield in the US stock market. The long-only portfolios are created by selecting the top 30% stocks ranked by the factor definitions, which are in line with industry and academic standards. Only stocks with a minimum market capitalization of $1 billion are included. Portfolios are rebalanced monthly and each transaction incurs costs of 10 basis points.
The single-factor portfolios effectively represent smart beta strategies, which are available to investors via low-cost ETFs. There is little academic support for the Growth factor generating positive excess returns, but it is a widely followed investment style, which warrants its inclusion in this analysis.
PAIRING THE VALUE FACTOR
Some factors are structurally highly correlated as they represent similar bets, e.g. sorting stocks by their dividend yield is one approach to determining if they are valued cheaply or expensive. However, even in this case, the correlation between the Value and Dividend Yield factors fluctuated across time.
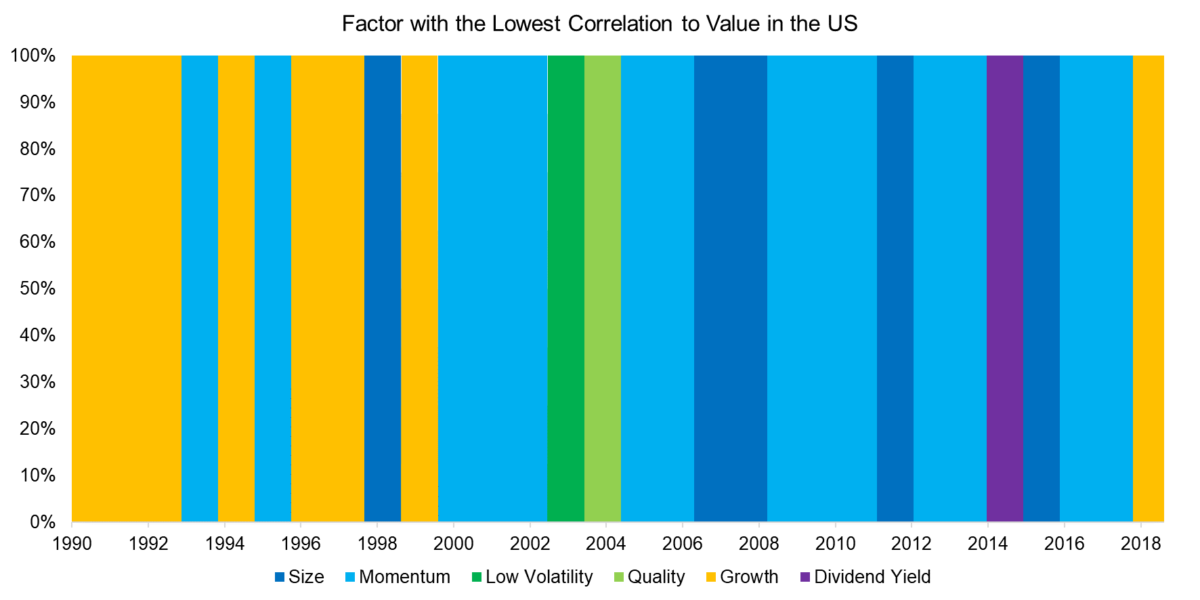
We can highlight the changing correlations by using the Value factor as a case study. We calculate the correlation of the Value portfolio to the six other factors using a one-year lookback and always select the factor with the lowest correlation. The analysis highlights that the Size, Momentum, and Growth factors most frequently appeared as exhibiting the lowest correlation with the Value factor, which implies higher correlations to the Low Volatility, Quality, and Dividend Yield factors.
Some of these relationships are expected, e.g. the low correlation between Value and Growth, while others like the higher correlation between Value and Quality may be more of a surprise.
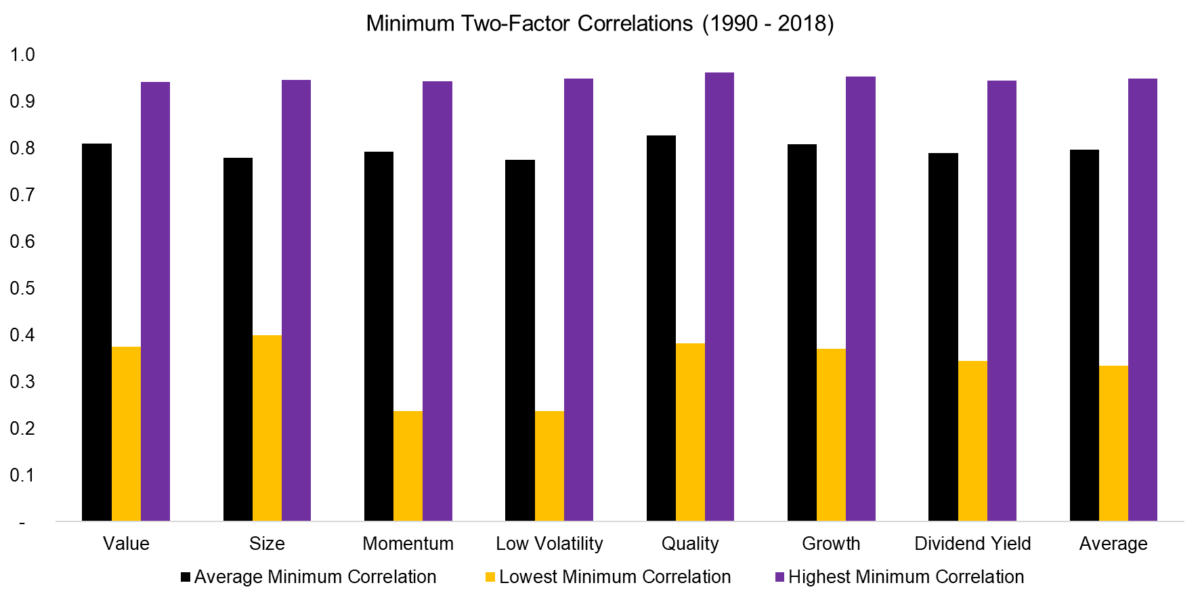
It is interesting to explore how factor correlations varied over the last 30 years. We observe the average minimum factor correlation was approximately 0.8 and almost the same across factors, which is perhaps explained by all factors representing long-only portfolios where most of the performance can be explained by the market beta.
The low and high points in minimum correlations were also comparable across factors. Correlations below 0.4 are relatively low for long-only portfolios and typically only reached when markets are significantly distorted, e.g. during the tech bubble in 2000. The high points of minimum correlations occurred during the global financial crisis from 2008 to 2009, when the correlations of almost all assets spiked and converged towards one.
TWO-FACTOR MINIMUM CORRELATION PORTFOLIOS
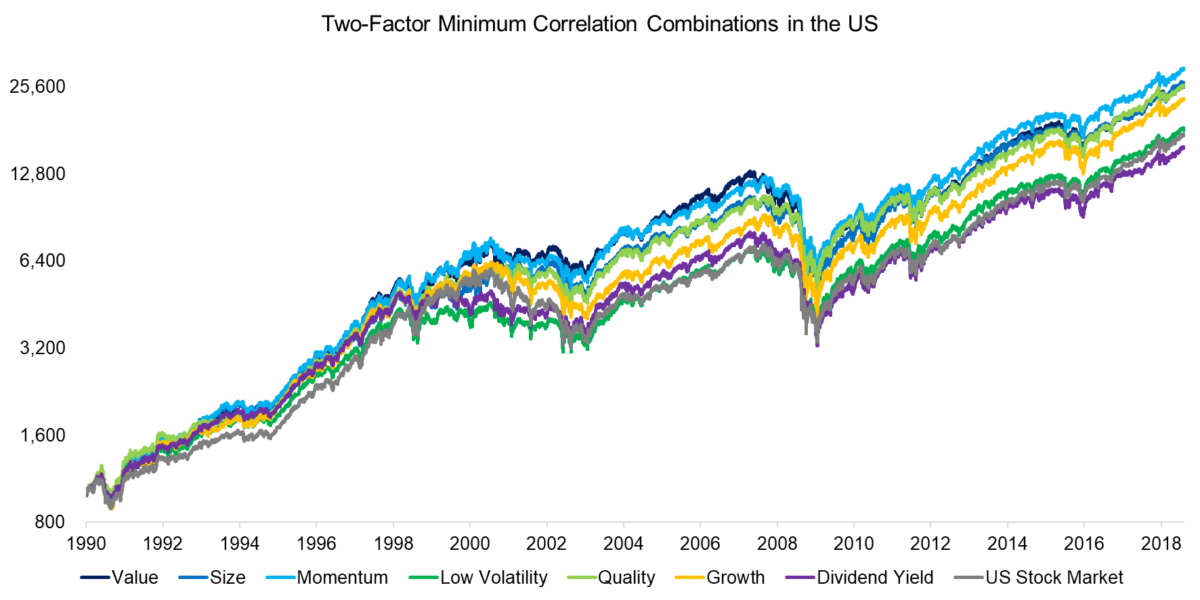
We create two-factor portfolios by combining each of the seven factors with the factor exhibiting the lowest correlation. The portfolios are weighted equally between the two factors and rebalanced annually. For example, cheap stocks might be combined with growth stocks for one year, then with small stocks for the following year, and so on.
We observe that all two-factor portfolios outperformed the US stock market in the period from 1990 to 2018, except for the portfolio including Dividend Yield. These results support the case for factor investing, but it should be noted that most of the excess returns were achieved during the tech bubble implosion between 2001 and 2003, where certain factors like Value, Size, and Low Volatility significantly outperformed the stock market.
ANALYZING MINIMUM CORRELATION PORTFOLIOS
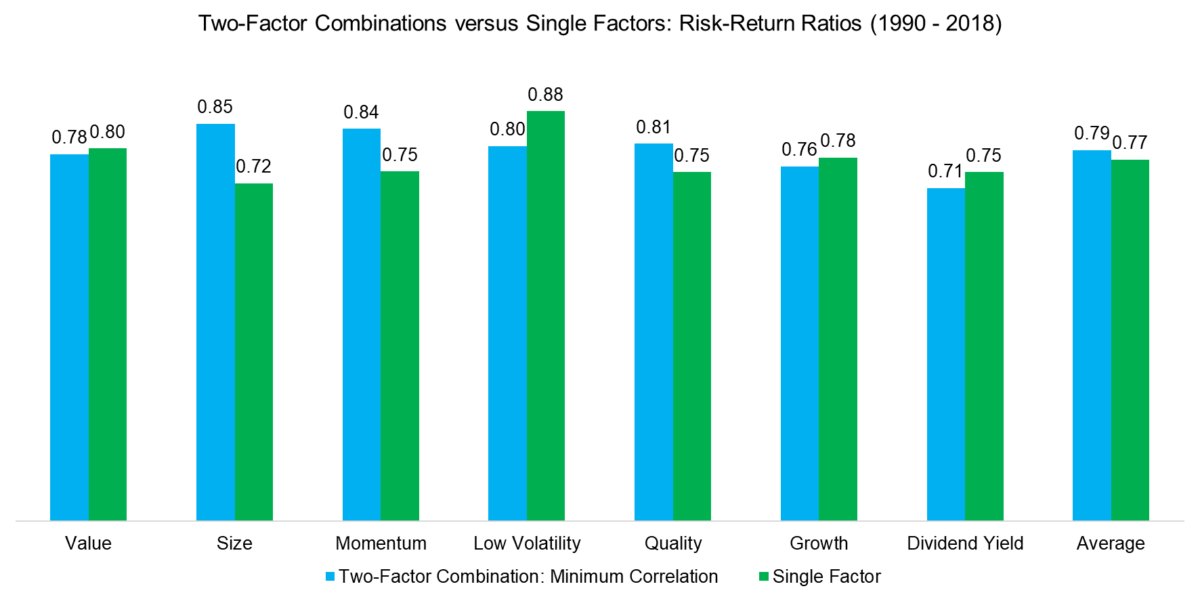
Intuitively, investors might expect that a multi-factor portfolio comprised of two factors, especially when selected on low correlations, should generate better risk-adjusted returns than a factor on a stand-alone basis.
However, analyzing the risk-adjusted returns between 1990 and 2018 highlights only marginal diversification benefits. The average risk-return ratio of the single-factor and two-factor portfolios were almost identical. Certain factors like Momentum benefited from being paired with a low-correlated factor, while others like Low Volatility did not. It is surprising that the diversification benefits were not stronger.
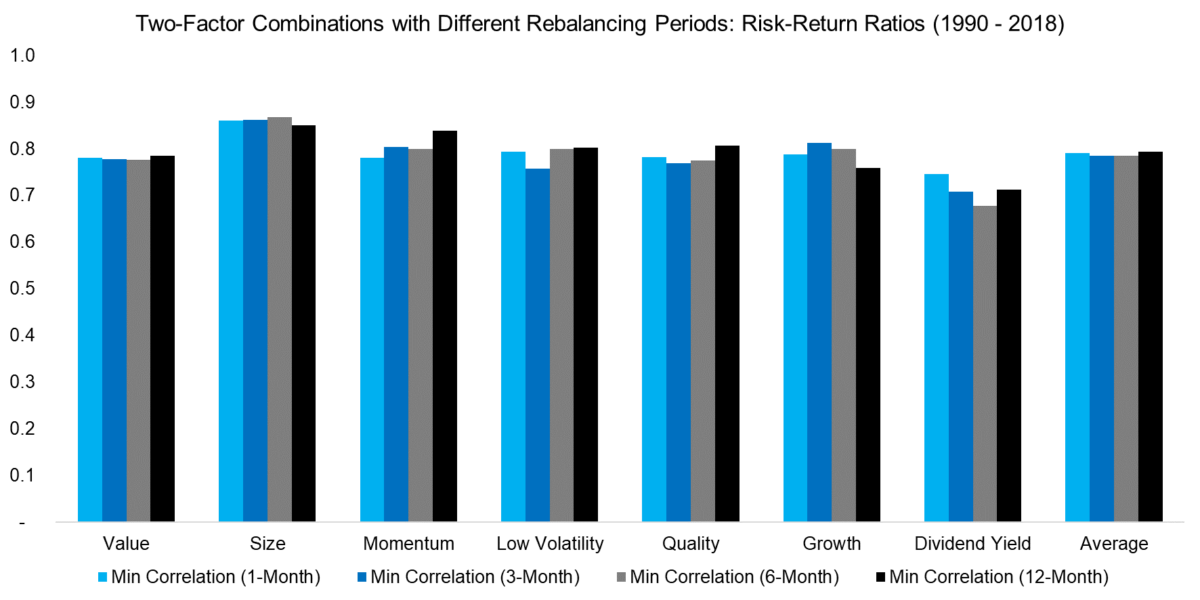
Perhaps the lack of larger diversification benefits can be explained by the choice of only rebalancing annually. Markets change continuously and perhaps more frequent rebalancing might extract more value by adjusting quicker to shifting correlations.
We rerun the analysis with monthly, quarterly, and semi-annual rebalancing, but the risk-return ratios do not change compared to annual rebalancing. Although markets change constantly, correlations were relatively stable over time. On a positive note, annual rebalancing results in low transaction costs and reduced portfolio maintenance.
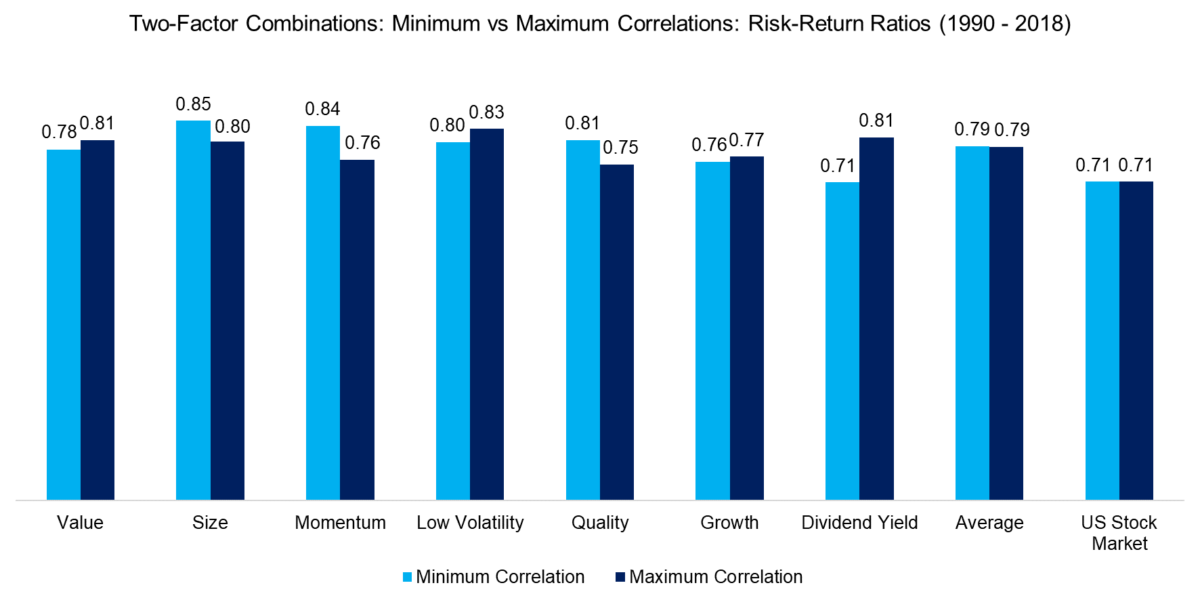
As a further step in analyzing the two-factor portfolios created by minimizing factor correlations, we construct portfolios based on maximum correlations. Somewhat unexpected, both approaches resulted in similar risk-return ratios, which suggests that correlations are perhaps less meaningful when creating two-factor portfolios than commonly assumed.
FURTHER THOUGHTS
The most favorite factor combinations are likely small and cheap as well as cheap and winning stocks. The correlations between these factors were low historically, which is perceived as attractive from a classic portfolio construction perspective.
This analysis highlights that combining two factors by minimizing correlations did not generate significant diversification benefits. Naturally, there is a significant amount of research, including our own, that shows that multi-factor portfolios generate higher risk-adjusted returns than factors on a stand-alone basis. However, most of the research is focused on combining theoretical long-short factors, which feature much lower correlations than long-only factor portfolios. Unfortunately, most investors pursue factor investing via long-only smart beta products. As usual, there is a difference between theory and reality.

About the Author: Nicolas Rabener
—
Important Disclosures
For informational and educational purposes only and should not be construed as specific investment, accounting, legal, or tax advice. Certain information is deemed to be reliable, but its accuracy and completeness cannot be guaranteed. Third party information may become outdated or otherwise superseded without notice. Neither the Securities and Exchange Commission (SEC) nor any other federal or state agency has approved, determined the accuracy, or confirmed the adequacy of this article.
The views and opinions expressed herein are those of the author and do not necessarily reflect the views of Alpha Architect, its affiliates or its employees. Our full disclosures are available here. Definitions of common statistics used in our analysis are available here (towards the bottom).
Join thousands of other readers and subscribe to our blog.