Characteristics of Mutual Fund Portfolios: Where Are the Value Funds?
- Martin Lettau, Sydney C. Ludvigson, Paulo Manoel
- Working paper
- A version of this paper can be found here
- Want to read our summaries of academic finance papers? Check out our Academic Research Insight category
What are the research questions?
If you’re a value investor who has determined that you have better things to do with your time, at some point you may have decided to outsource the investment task to a fund manager. And if you read our blog (especially this post) you’re probably looking to outsource to a systematic process versus a discretionary one. The first step in your due diligence process is easy: ask your smart friends for advice and google for “Value Funds.” A plethora of options will be available, as there are thousands of funds with “value” in their description.(1)
But do these funds actually seek to capture the so-called “value factor?” Sadly, naming funds “value” is a lot more popular than actually investing in systematic “value.” Using a sample of 2,638 active mutual funds (574 value plus 1,130 growth funds), 955 ETFs, and 114 hedge funds, the authors focus on three basic issues.
- Do active fund managers exploit traditional value factor risk premia across the universe of US mutual funds?
- Does the average fund exhibit similar asymmetry?
- What about other traditional factors like size and momentum?
While the results obtained for ETFs and hedge funds were similar to that of mutual funds, this summary will deal with mutual funds.
What are the Academic Insights?
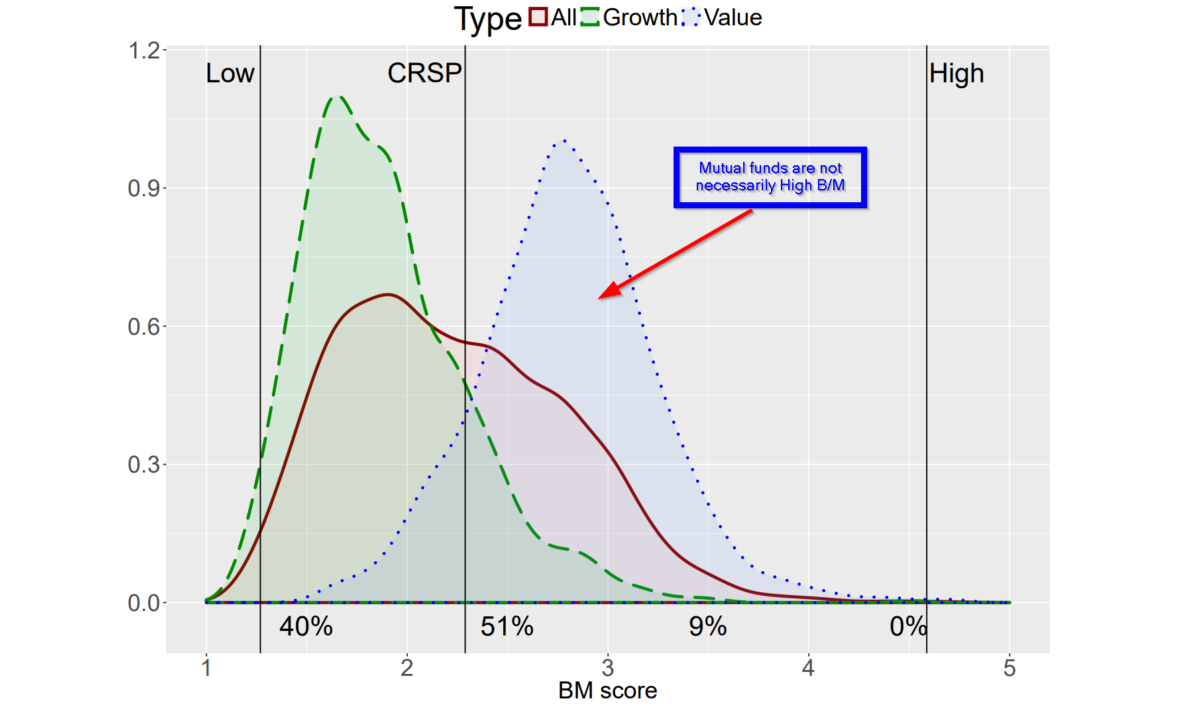
- NO. Across the universe of mutual funds, the analysis in this article documents the finding that funds tend to hold securities on the low return leg of the long/short value factor portfolio. This was especially true for funds using the book-to-market ratio(2) to identify value stocks. ETFs and hedge funds exhibited a similar tilt towards low book-to-market ratios. There were no funds that exhibited a tilt towards high book-to-market stocks, even when the fund was explicitly marketed as a value fund. Not to be eclipsed, the same pattern was observed for earnings-to-price, dividend-to-price, and the Morningstar value/growth measure for the same mutual funds, ETFs, and hedge funds. More details are supplied in Figure 1 below. For context, note the book-to-market ratio ranges from “1” to “5”, where “1” = the extremely low quintile of book-to-market and “5” = the extremely high quintile value. Forty percent of funds fell between quintile 1 and quintile 2– extremely low value; 9% fell between Q2 and Q3–moderate value; however, only 7 of 2,657 funds in the sample had a ratio greater than Q4–high or very high value. Essentially, there were no real value funds in the US universe of all mutual funds in the sample. The takeaway here is that it is almost impossible to replicate a value portfolio, or the Fama-French value or “H” portfolio by looking to the mutual fund industry. If one focuses on explicitly labeled “value funds” the situation is not much better. Note from Figure 1 that the majority of value funds fall between Q2 and Q3.5–middle of the road. However, there was an abundance of growth-oriented funds, that were in fact, high “growth”. Amazingly, the majority of growth funds fall between Q1 and Q2. Growth is everywhere and value is nowhere to be found. The results were robust to other measures of value and characteristics of other vehicles such as ETFs and hedge funds. The reader should be aware that the sample size and therefore, the representativeness of hedge funds and ETFs to a lesser degree, is poor.
- YES. On average, the average mutual fund allocates its holdings to stocks with book-to-market scores between Q1 and Q2 at 40% and allocates only 6% to stocks to Q5. Value funds tilt more toward low Q stocks, with 24% to Q1 and 13% with Q5 scores. It gets worse: only 7% of value funds held more than 25% of their portfolios in Q5 stocks. Again growth funds presented a stark contrast. Almost all (95%) of growth funds allocated over a quarter of their holdings to low book-to-market stocks. A respectable representation for the Fama-French “L” portfolio.
- The asymmetry observed with value metrics was not present with size and momentum factors, although the average mutual fund does not appear to exploit the high return risk premia associated. The average fund had scores slightly above Q3: momentum at 3.28, investment at 3.08, and profitability at 3.17, indicating little to no significant exposures in either direction to these factors. A very small percentage (4%) of funds have a high momentum tilt with a score above Q4. However, the variability of the momentum score over time was higher than for other factors, so the overall distribution is less indicative of the average funds’ momentum tilt at any one point in time. As to intention, the authors suggest that the momentum characteristic is likely a function of the contemporaneous holdings of low book-to-market stocks instead of an intentional bet on momentum. The results concerning size are not new. Mutual funds do not exploit the small stock premium, even if it does exist. Only 2% of all mutual funds exhibit a score that is representative of the small stock leg of the classic long/short factor portfolio. The conventional wisdom explains it: large funds hold large-capitalization stocks because smaller stocks are more expensive to trade. Enough said.
Why does it matter?
The analysis of the factor exposures/characteristics of mutual funds suggests that the array of strategies offered by the fund industry are really quite limited. It is all but impossible to replicate value, momentum and size-based portfolios or any combination of such, by investing in mutual funds.(3) Further, the consistent exposure to low book-to-market stocks is frankly difficult to defend given the large body of empirical work on return drivers in the equity market. The adherence to low book-to-market strategies that promise a low return and are basically neutral to momentum for example, is more than puzzling. Many more questions arise, than are answered in this research regarding the active management offered by mutual funds. The authors propose at least four that convey why this research matters:
“1. Why is the distribution of mutual fund portfolios so strongly tilted towards low book-to-market ratios and why are there virtually no high BM funds at all even though high BM stocks are associated with higher returns than low BM stocks? 2. Why do funds that label themselves as “value” hold more low BM stocks than high BM stocks while “growth” funds hold almost exclusively low BM stocks?3. Why are portfolios of active mutual funds not more tilted towards other factors that are associated with high returns, i.e. small and high momentum stocks?4. Why don’t mutual funds combine multiple factor strategies (e.g., high BM – high momentum) that have been shown to be more profitable than univariate strategies.”
The most important chart from the paper
Abstract
This paper provides a comprehensive analysis of portfolios of active mutual funds, ETFs and hedge funds through the lens of risk (anomaly) factors. We show that that these funds do not systematically tilt their portfolios towards profitable factors, such as high book-to-market (BM) ratios, high momentum, small size, high profitability and low investment growth. Strikingly, there are almost no high-BM funds in our sample while there are many low-BM “growth” funds. Portfolios of “growth” funds are concentrated in low BM-stocks but “value” funds hold stocks across the entire BM spectrum. In fact, most “value” funds hold a higher proportion of their portfolios in low-BM (“growth”) stocks than in high-BM (“value”) stocks. While there are some micro/small/mid-cap funds, the vast majority of mutual funds hold very large stocks. But the distributions of mutual fund momentum, profitability and investment growth are concentrated around market average with little variation across funds. The characteristics distributions of ETFs and hedge funds do not differ significantly from the those of mutual funds. We conclude that the characteristics of mutual fund portfolios raises a number of questions about why funds do not exploit well-known return premia and how their portfolio choices affects asset prices in equilibrium.

References[+]
| ↑1 | Or get access to the AA Portfolio Architect tool which is specifically designed to assess fund characteristics. |
|---|---|
| ↑2 | Note that the paper is utilizing Book/market where value is represented by a high ratio, unlike the more standard price/book ratio where a low ratio represents value |
| ↑3 | Although, Alpha Architect, and others, via more factor-centric indexes are trying to help solve this problem! |
About the Author: Tommi Johnsen, PhD
—
Important Disclosures
For informational and educational purposes only and should not be construed as specific investment, accounting, legal, or tax advice. Certain information is deemed to be reliable, but its accuracy and completeness cannot be guaranteed. Third party information may become outdated or otherwise superseded without notice. Neither the Securities and Exchange Commission (SEC) nor any other federal or state agency has approved, determined the accuracy, or confirmed the adequacy of this article.
The views and opinions expressed herein are those of the author and do not necessarily reflect the views of Alpha Architect, its affiliates or its employees. Our full disclosures are available here. Definitions of common statistics used in our analysis are available here (towards the bottom).
Join thousands of other readers and subscribe to our blog.