As my co-author Andrew Berkin and I explain in our new book “Your Complete Guide to Factor-Based Investing,” there is considerable evidence of cross-sectional return predictability. Citing more than 100 academic papers, we presented evidence of predictability for both equity and bond factors. And since the research is well known, one would think that sophisticated professional investors would be betting on the factors that show predictability, while the less-informed retail money would be on the other side of the trade. Is that actually the case?
In their 2017 paper, “Analysts and Anomalies” Joseph Engelberg, David McLean, and Jeffrey Pontiff examined the recommendations of U.S. security analysts over the period 1994 through 2014 and found that analysts’ predictions go in the opposite direction of the academic evidence—they conflict with well-documented anomalies (similar findings were reported here). And the results were statistically significant. They also found that buy recommendations do not predict returns, while sell recommendations predict lower returns. Another interesting finding was that among the group of “market” anomalies (such as momentum and idiosyncratic risk), which are based only on stock return, price and volume data, analysts produce more favorable recommendations and forecast higher returns among the stocks that are stronger buys according to market anomalies. This is perhaps surprising as analysts are supposed to be experts in firms’ fundamentals. Yet, they performed best with anomalies that are not based on accounting data. Their evidence suggests that analysts even contribute to mispricing as their recommendations are systematically biased by favoring stocks that are overvalued according to an anomaly-based composite of mispricing scores.
The only good news was that Engelberg, McLean, and Pontiff found that over time, as anomaly variables have become widely known, analysts have incorporated more of this information into their recommendations and price targets—the negative correlation weakened over their sample period. However, even during the later years of their sample there was still a negative or, at best, neutral relationship.
They concluded:
“Analysts today are still overlooking a good deal of valuable, anomaly-related information.”
New Research
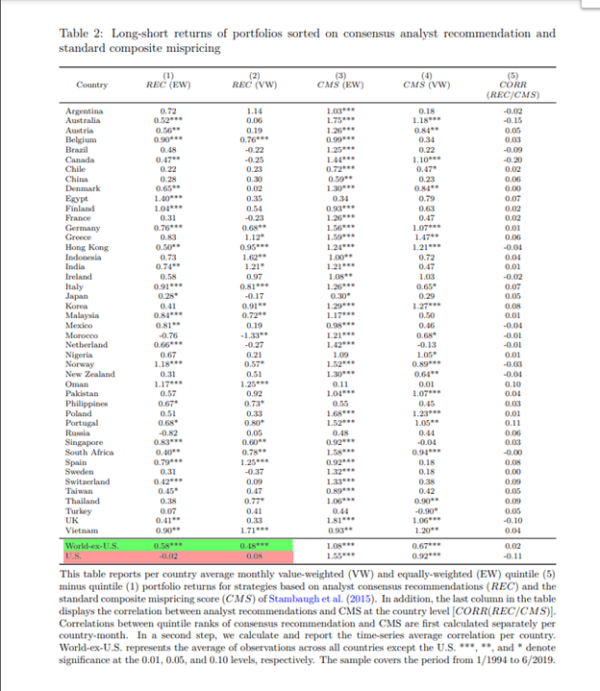
Vitor Azevedo and Sebastian Müller contribute to the literature with their October 2020 study, “Analyst Recommendations and Anomalies Across the Globe.” They examined the value of analyst recommendations with a dataset of 45 countries and 3.8 million firm-month observations covering the period 1994 to 2019.
In order to analyze the relation between analyst recommendations and anomalies, they created composite scores on 11 anomalies identified by Robert Stambaugh, Jianfeng Yu, and Yu Yuan, authors of the 2012 study “The Short of It: Investor Sentiment and Anomalies.” The 11 pricing anomalies reflect sorts on measures that include:
- financial distress (firms with high failure probability have lower, not higher, subsequent returns),
- net stock issuance (issuers underperform non-issuers),
- accruals (firms with high accruals earn abnormally lower returns on average than firms with low accruals),
- net operating assets (defined as the difference on a company’s balance sheet between all operating assets and all operating liabilities scaled by total assets, it is a strong negative predictor of long-run stock returns),
- momentum (high past recent returns forecast high future returns),
- the gross profitability premium (more profitable firms have higher returns than less profitable ones),
- asset growth (companies that grow their total assets more earn lower subsequent returns),
- return on assets (more profitable firms have higher expected returns than less profitable firms) and
- investment-to-assets (higher past investment predicts abnormally lower future returns).
- O-Score: This is an accounting measure of the likelihood of bankruptcy. Firms with higher O-scores have lower returns.
- Post-earnings Announcement Drift: If earnings surprises are positive (negative), future stock prices drift upward (downward)— stock prices drift in the same direction as the earnings surprise.
The most underpriced (overpriced) stock received the lowest (highest) rank. Then, they computed the arithmetic average of the anomaly ranks for each firm-month with at least five anomalies, and used the average anomaly ranks to assign these firms into quintiles for each country-month and estimate a long-short portfolio, which goes long (short) in the most underpriced (overpriced) stocks.
Following is a summary of their findings:
- Analyst recommendations lead to highly significant (at the 1% confidence level) abnormal returns in international markets, though not in the U.S. where analysts tend to recommend U.S. stocks which are overvalued based on anomalies.
- In international markets analysts do not contribute to global mispricing, tending to give more favorable recommendations to underpriced (based on anomaly ranking) stocks—analyst recommendations are positively related to composite, anomaly-based mispricing scores.
- A recommendations-based long-short strategy generates a value-weighted (equally-weighted) raw return of 0.48% (0.58%) per month with a t-statistic of 5.05 (8.51) in worldwide stock markets excluding the U.S. In contrast, the same strategy for U.S. stocks yields economically negligible and statistically insignificant value-weighted and equally-weighted raw returns of 0.08% and -0.02% per month, respectively.
- The pronounced market differences in profitability persist for a range of alternative asset pricing models, including the CAPM, the Fama and French (1993) three-factor model, the Carhart (1997) four-factor model, the Fama and French (2015) five-factor model, the behavioral factor model of Daniel et al. (2020), the mispricing factor model of Stambaugh and Yuan (2017), and the (augmented) q-factor model of Hou et al. (2015) and Hou et al. (2020).
- Recommendations are more valuable in less developed and in less individualistic markets (helping explain U.S. results) and during low-sentiment periods.
The authors did note that there is evidence that the performance of the recommendations-based strategy has declined over time (evidence of increasing market efficiency).
“For the first part of our sample period from January 1994 to December 2006, the strategy’s value-weighted four-factor alpha amounts to 0.45% per month (t-statistic: 4.07) for World-ex-US. In the second part of the sample period from January 2007 to June 2019, the strategy’s international four-factor alpha decreases to 0.25% per month (t-statistic: 2.34).”
Their findings led Azevedo and Müller to conclude:
“Our results support limits-to-arbitrage and behavioral explanations of global stock market inefficiencies…The fact that analyst recommendations are less profitable in individualistic countries and in high sentiment periods supports the view that even market professionals are subject to behavioral biases that affect market outcomes.”
Do International Mutual Funds Exploit Analyst Forecasts?
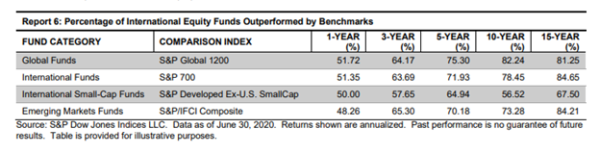
While the evidence on analyst recommendations in international markets showed that they added value, that doesn’t necessarily translate into alpha for mutual funds. One reason is that recommendations don’t have expenses, while implementing them does (transactions costs and fund expense ratios). To see whether mutual funds are able to exploit analyst recommendations we turn to the results from the 2020 Mid-Year SPIVA Scorecard:
- Over the 15-year period, across all international equity categories, a large majority of active managers underperformed their respective benchmarks. For example, 81% of active global funds underperformed, 85% of international funds underperformed, 68% of international small-cap funds underperformed, and in the supposedly inefficient emerging markets, 84% of active funds underperformed.
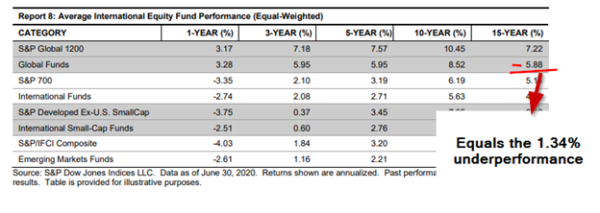
- Over the 15-year period, on an equal-weighted (asset-weighted) basis, active global funds underperformed by 1.3% (0.4%) per annum, active international funds underperformed by 1% (0.3%) per annum, and active emerging market funds produced the worst performance, underperforming by 1.8% (0.6%) per annum. And while, on an equal-weighted basis, international small-cap funds underperformed by 0.3%, on an asset-weighted basis, they managed to outperform by 0.4%.
As you can see, mutual funds were not able to exploit analyst recommendations. The takeaway for investors, whether in the U.S. or in international markets is that the strategy most likely to allow you to achieve your goals is to use funds that invest systematically (such as index funds) and eschew individual security selection. The other takeaway is that over time, and despite the claims that the trend to passive investing would reduce market efficiency, markets are becoming more efficient. The reasons for this are the subject of Andrew Berkin and my new book, the 2020 edition of The Incredible Shrinking Alpha.

About the Author: Larry Swedroe
—
Important Disclosures
For informational and educational purposes only and should not be construed as specific investment, accounting, legal, or tax advice. Certain information is deemed to be reliable, but its accuracy and completeness cannot be guaranteed. Third party information may become outdated or otherwise superseded without notice. Neither the Securities and Exchange Commission (SEC) nor any other federal or state agency has approved, determined the accuracy, or confirmed the adequacy of this article.
The views and opinions expressed herein are those of the author and do not necessarily reflect the views of Alpha Architect, its affiliates or its employees. Our full disclosures are available here. Definitions of common statistics used in our analysis are available here (towards the bottom).
Join thousands of other readers and subscribe to our blog.