Economic theory hypothesizes that risk-seeking investors who are leverage constrained would be willing to pay a higher management fee for access to betas greater than 1.0. As Steffen Hitzemann, Stanislav Sokolinski and Mingzhu Tai, authors of the study “Paying for Beta: Leverage Demand and Asset Management Fees,” published in the July 2022 issue of the Journal of Financial Economics, explained:
Consider two investors with different risk profiles who need to choose an asset manager and can easily obtain leverage. The risk-seeking investor seeks an above-the-market return with a market beta of 1.5, while the risk-averse investor seeks a below-the-market return with a beta of 0.5. To obtain the desired return, the risk-seeking investor borrows 50% of her wealth and makes a leveraged investment in a market index fund. The risk-averse investor equally splits her holdings between the index fund and the risk-free asset. But if the risk-seeking investor cannot borrow, she has to find a manager who can deliver a leveraged portfolio with a beta of 1.5. This manager can charge an extra fee for providing leverage to the constrained risk-seeking investor, irrespective of the potential fees associated with the manager’s risk-adjusted return.
The manager can provide the leverage either through the use of derivatives or by building a portfolio with a beta of more than 1.0.
To test the hypothesis, Hitzemann, Sokolinski and Tai examined how investor demand for leverage shapes asset management fees—under leverage constraints, are investors willing to pay extra fees to high-beta asset managers because those managers provide returns investors cannot obtain on their own? Their sample consisted of open-end mutual funds from the CRSP U.S. Mutual Fund Database covering the period January 1991-December 2016.
Following is a summary of their findings:
- The average fund had a beta of 1.0, and the distribution was almost symmetric with many fund offerings concentrated around betas in the range of 0.9 to 1.1. As beta moved away from 1.0, the number of fund offerings declined. Most of the U.S. equity mutual funds had market betas in the range of 0.2 to 1.7.
- Most of the high-beta funds relied on high-beta stocks to obtain their betas—they were not more likely to engage in borrowing, use of derivatives or short-selling, and they did not face higher stock trading costs.
- While the average gross CAPM alpha was positive, the average net CAPM alpha equaled -0.26 percent (t-stat = -2.28)—suggesting that the returns to investors turn negative on average due to the effect of fees.
- Fees increase in fund market beta for beta more than 1.0—fees progressively increased with beta across managers because managers with higher betas have more risk-seeking investor clienteles. When fund beta increased from 1.0 to 1.7, the top of the sample distribution, fund fees increased by 34 basis points, a 22 percent increase relative to the median fee.
- Because risk-averse investors do not require leverage, fees of asset managers with betas smaller than 1.0 do not increase in beta.
- The relationship between a fund’s market beta and fees became stronger when leverage constraints tightened.
- For the same increase in beta, the increase in fees paid by retail investors (who are more leverage constrained) was almost twice as large as for institutional investors.
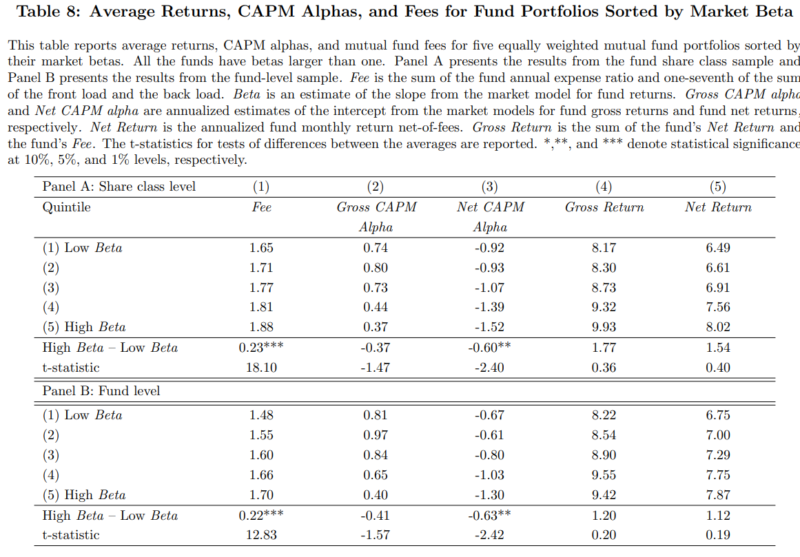
- Fund net alphas declined in beta and were particularly negative for beta greater than 1.0—net-of-fees underperformance was exacerbated for high-beta funds. In the sample of funds with betas greater than 1.0, the difference in net alphas between the low-beta and the high-beta fund portfolios was 60 basis points per year. Both high fees and the poor performance of high-beta stocks (the CAPM security line is relatively flat, implying that high beta stocks have poor alphas) contributed to the poor performance of high-beta funds.
- Gross alpha declined with beta in line with a relatively flat security market line in the asset market, and net alpha declined with beta 1 1/2 to two times as fast as gross alpha.
- While low-beta funds had net CAPM alphas of -0.67 versus -1.30 for high-beta funds, high-beta funds did produce 1.12 percentage point higher net returns, though the difference was not statistically significant (t-stat = 0.19)—high-beta funds were therefore attractive to leverage-constrained, risk-seeking investors even though the risk-return relation from the asset market was flatter than predicted by the CAPM and they paid higher fees.
Their findings led Hitzemann, Sokolinski and Tai to conclude that their results “suggest that asset managers can earn fees above their risk-adjusted returns for providing their investors with leverage.” They added:
These findings suggest that two mechanisms can jointly explain why net performance declines with beta: (1) the leverage demand effect of fund investors presented in this paper, which drives the increase in fees; and (2) the asset market mechanism which drives the decline in gross alpha.
Investor Takeaways
The evidence presented demonstrates that risk-seeking investors who face borrowing constraints, and are limited in making leveraged investments on their own, seek out managers to obtain the desired leveraged—they are willing to pay higher fees to obtain greater exposure to the market beta risk factor even though high-beta stocks have historically provided poor risk-adjusted returns. Those higher fees and the negative alphas of high-beta stocks result in poor risk-adjusted returns, but higher returns unadjusted for the incremental risks. Thus, those leverage-constrained, risk-seeking investors did improve their welfare by gaining access to leverage. However, those same investors could have achieved their goal of higher returns without paying higher fees, and they could have avoided investing in stocks with negative alphas (those high-beta stocks). Instead of increasing their exposure to market beta, they could have increased their exposure to other factors such as size, value, profitability/quality and momentum and avoided both paying the higher fees for market beta and buying stocks with negative alphas. They would have had a more diversified portfolio, gaining exposure to other unique sources of risk. Diversification across factors, not increased leverage, is the superior solution.
Disclaimers
For informational and educational purposes only and should not be construed as specific investment, accounting, legal, or tax advice. Certain information is deemed to be reliable, but its accuracy and completeness cannot be guaranteed. By clicking on any of the links above, you acknowledge that they are solely for your convenience, and do not necessarily imply any affiliations, sponsorships, endorsements or representations whatsoever by us regarding third-party websites. We are not responsible for the content, availability or privacy policies of these sites, and shall not be responsible or liable for any information, opinions, advice, products or services available on or through them. The opinions expressed by featured authors are their own and may not accurately reflect those of Buckingham Strategic Wealth® and Buckingham Strategic Partners®, collectively Buckingham Wealth Partners. Neither the Securities and Exchange Commission (SEC) nor any other federal or state agency have approved, determined the accuracy, or confirmed the adequacy of this article. LSR-22-357

About the Author: Larry Swedroe
—
Important Disclosures
For informational and educational purposes only and should not be construed as specific investment, accounting, legal, or tax advice. Certain information is deemed to be reliable, but its accuracy and completeness cannot be guaranteed. Third party information may become outdated or otherwise superseded without notice. Neither the Securities and Exchange Commission (SEC) nor any other federal or state agency has approved, determined the accuracy, or confirmed the adequacy of this article.
The views and opinions expressed herein are those of the author and do not necessarily reflect the views of Alpha Architect, its affiliates or its employees. Our full disclosures are available here. Definitions of common statistics used in our analysis are available here (towards the bottom).
Join thousands of other readers and subscribe to our blog.