Intraday Momentum: The First Half-Hour Return Predicts the Last Half-Hour Return
- Gao, Han, and Zhou
- A version of the paper can be found here.
- Want a summary of academic papers with alpha? Check out our Academic Research Recap Category!
Abstract:
In this paper, using intra data from January 4, 1999 to December 31, 2012, we document an intraday momentum pattern that the first half-hour return on the market predicts the market return in the last half-hour. The predictability is both statistically and economically significant, and is stronger on high volatile days, recession days and some macroeconomic news release days. We interpret the trading behavior of daytraders and informed traders as the economic driving forces behind the intraday momentum.
Alpha Highlight:
Jegadeesh and Titman (1993) initially documented that past winners continued to be winners and past losers continued to be losers. Their “momentum” finding has been studied and confirmed in follow on research.
Why is this paper different?
Most papers examine momentum at a monthly frequency. This paper asks a simple question: Is there a simple intraday momentum strategy?
The authors find that the first half-hour of trading affects the last half-hour of trading.
How do they test this? First, they look for some relationship between the first half-hour of trading and the last half-hour of trading (there are 13 half-hours of trading). They run a predictive regression where they regress the returns for the last half-hour of trading (r_13) on the returns from the first half-hour of trading (r_1) and the returns from the twelfth half-hour of trading (r_12). The data is based off the SPDR S&P 500 ETF Trust (SPY) from 1/4/1999 until 12/31/2012.The results are shown below:
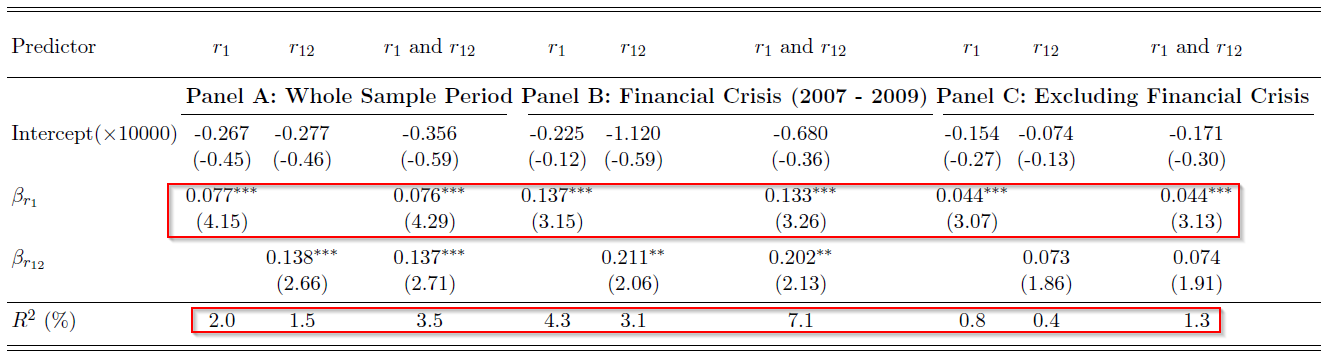
The results are hypothetical results and are NOT an indicator of future results and do NOT represent returns that any investor actually attained. Indexes are unmanaged, do not reflect management or trading fees, and one cannot invest directly in an index. Additional information regarding the construction of these results is available upon request.
The table above shows a positive loading on r_1 (as well as r_1 and r_12) for all time periods, so the returns from the first half-hour positively and statistically predict returns during the last half-hour. Additionally, the regressions yield an R-squared value of 2% over the entire time period, and 4.3% during the financial crisis.
Is there a way to trade this finding?
The authors suggest going long (short) the last half-hour if the market return is positive (negative) during the first half-hour. A second strategy would be to go long (short) the last half-hour if the market return is positive (negative) during the twelfth half-hour. A third strategy would be to go long (short) the last half-hour if the market return is positive (negative) during the first and twelfth half-hour, otherwise earn zero return. The results are shown below:
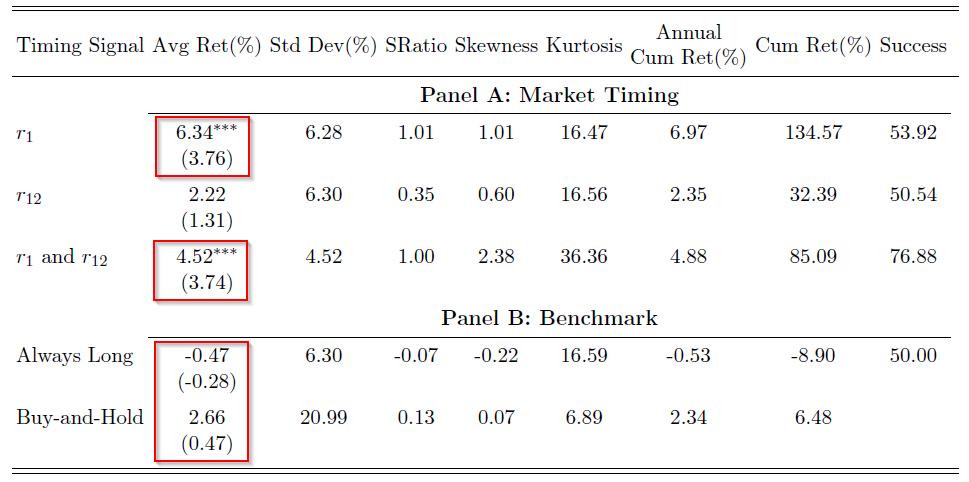
The results are hypothetical results and are NOT an indicator of future results and do NOT represent returns that any investor actually attained. Indexes are unmanaged, do not reflect management or trading fees, and one cannot invest directly in an index. Additional information regarding the construction of these results is available upon request.
The table above shows that a simple intraday momentum strategy earns an annual return of 6.34% when trading simply off the returns of the first half-hour of trading. Compared to a strategy of always going long during the last half hour (“Always Long”) and a simple Buy-and-Hold strategy. The simple intraday momentum strategy outperforms.
The authors give two potential explanations for this finding: trading behavior of daytraders (disposition effect), and strategic trading of informed traders.
What do you think? Time to become a day-trader?

About the Author: Jack Vogel, PhD
—
Important Disclosures
For informational and educational purposes only and should not be construed as specific investment, accounting, legal, or tax advice. Certain information is deemed to be reliable, but its accuracy and completeness cannot be guaranteed. Third party information may become outdated or otherwise superseded without notice. Neither the Securities and Exchange Commission (SEC) nor any other federal or state agency has approved, determined the accuracy, or confirmed the adequacy of this article.
The views and opinions expressed herein are those of the author and do not necessarily reflect the views of Alpha Architect, its affiliates or its employees. Our full disclosures are available here. Definitions of common statistics used in our analysis are available here (towards the bottom).
Join thousands of other readers and subscribe to our blog.