Investors have been worrying, at least for the last several years, that the market is overvalued. By some measures this is undoubtedly true. Just yesterday we highlighted that the Shiller CAPE is in the 94th percentile as of 1/31/2015.
And as valuations have gone higher, the alarm bells in the press have gotten louder.
- Warren Buffett is “Dumping [US shares] at an alarming rate.”
- Nobel-Winner, and famed market commentator, Robert Shiller, says “I may get out of US stocks“
- And, of course, Goldman Sachs is now telling everyone, “The Smart Money Is Selling, Not Buying.”
Digging into the Goldman Sachs call is illuminating. Here is what Goldman’s chief strategist David Kostin says on current market valuations:
Stocks with attractive valuation are rare in the current environment of stretched share prices. The aggregate S&P 500 trades at 17.3x forward EPS and 10.2x EV/EBITDA. The only time during the past 40 years that the index traded at a higher multiple was during the 1997-2000 Tech Bubble. The median stock sports a P/E and EV/EBITDA of 18.0x and 11.0x, respectively. These valuations rank in the 99th percentile of both P/E and EV/EBITDA multiples since 1976.
The implicit assumption underlying Kostin’s “story” is that knowing that the market is in the 99th percentile somehow improves our ability to time the market.
A great story–but is there any evidence to support this claim?
Does Goldman’s 99% Valuation-Timing Rule Work?
We’ve analysed tactical asset allocation using valuation measures in the past.
The evidence isn’t promising: Trend-following timing rules have been much more effective than valuation-based timing rules.
Nonetheless, the Goldman Sachs article inspired us to dig into the valuation-timing hypothesis.
To create our “valuation-timing” indicator, every month we identify the 99 percentile valuations using rolling 5-, 10-, and 20-year look-back periods. Our trading rule is simple: if the current market valuation is greater or equal to the 99 percentile measure, we invest in the risk-free rate (short-term treasury bills), otherwise, we stay invested.
We compare the valuation-timing indicator to a monthly-assessed simple moving-average (MA) trading rule, and a buy-and-hold strategy. The buy-and-hold strategy is straightforward, and the MA indicator is simple: if the current market price is lower than the 12 month moving average, we invest in the risk-free rate (short-term treasury bills), otherwise, we stay invested.
Our conclusion is counterintuitive, but not entirely surprising: Goldman’s “Valuation-Timing” concept doesn’t have legs.
Strategy Details:
For the MA signals, we use a monthly-assessed 12-month MA rule on the S&P 500 total return index.
- If the price for last month is above the past 12 months average, stay in the market; otherwise, invest in the risk-free asset.
For the valuation signal, we use CAPE, Shiller’s Cyclically Adjusted PE ratio. Results are similar for P/E and enterprise multiples, but for public replication purposes we use the CAPE data (we sometimes make mistakes and want others to let us know!). CAPE raw data can be accessed from Shiller’s database.
- If last month’s CAPE valuation is in the 99 percentile or higher, buy U.S. Treasury bills (Rf), otherwise stay in the market. For robustness purposes, we use three different rolling look-back periods to determine the 99 percentile valuation at a given point in time: 5-, 10- and 20- years.
Our backtest period is from 1/1/1947 to 1/31/2015 (we start in 1947 because we need to burn 20 years of data for the 20-year look-back metric). Results are gross, no fees are included, and only index returns are included. Indexes are unmanaged, do not reflect management or trading fees, and one cannot invest directly in an index. All returns are total returns and include the reinvestment of distributions (e.g., dividends). Strategies are all monthly-rebalanced, meaning Goldman’s valuation litmus test is applied every month.
Strategy Legend:
- SP500 = S&P 500 Total Return Index
- LTR = The Merrill Lynch 10-year U.S. Treasury Futures Total Return Index
- Rolling 5 year 99perc CAPE= Timing signal uses the 99th percentile valuation metric using rolling 5 year look-back periods.
- Rolling 10 year 99perc CAPE = Timing signal uses the 99th percentile valuation metric using rolling 10 year look-back periods.
- Rolling 20 year 99perc CAPE= Timing signal uses the 99th percentile valuation metric using rolling 20 year look-back periods.
- (1,12) MA= If last month’s price is above the past 12 month average, invest in the S&P 500; otherwise, buy U.S. Treasury Bills (RF).
Statistics Summary:
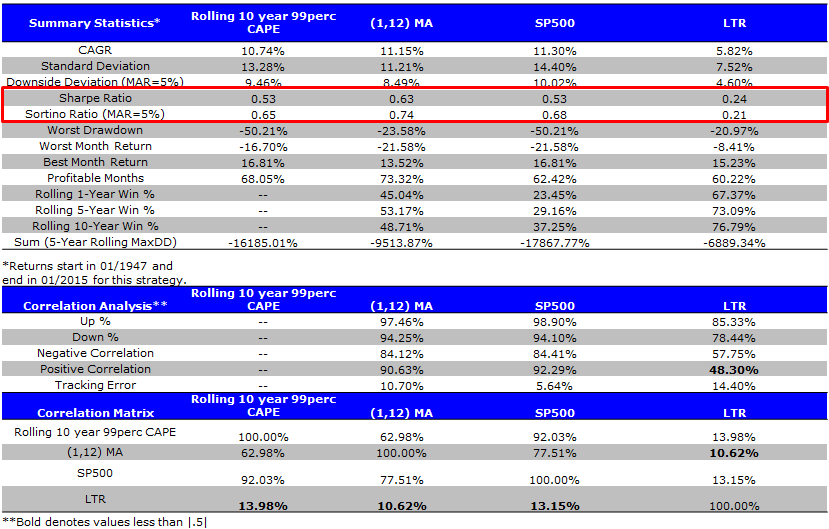
Full Sample: 1/1/1947 – 1/31/2015
- (1,12) MA outperforms Rolling 10 year Valuation Timing.
- Buy-and-hold is similar to Valuation-Timing.
The results are hypothetical results and are NOT an indicator of future results and do NOT represent returns that any investor actually attained. Indexes are unmanaged, do not reflect management or trading fees, and one cannot invest directly in an index. Additional information regarding the construction of these results is available upon request.
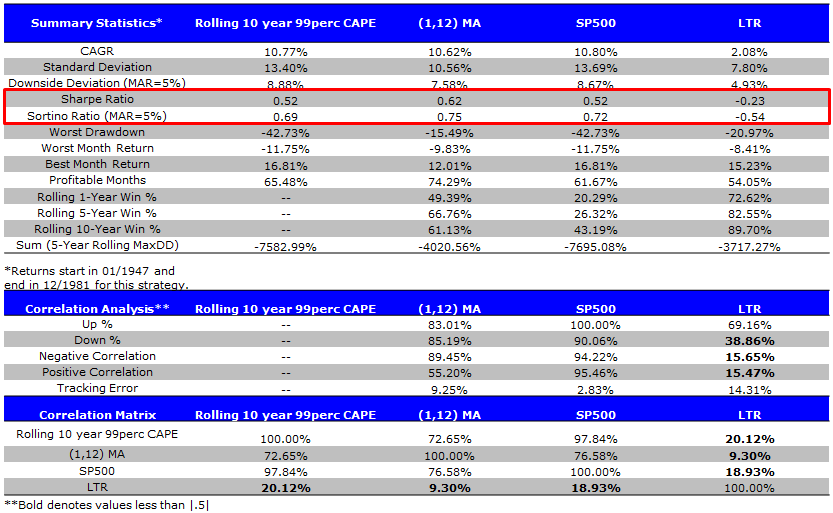
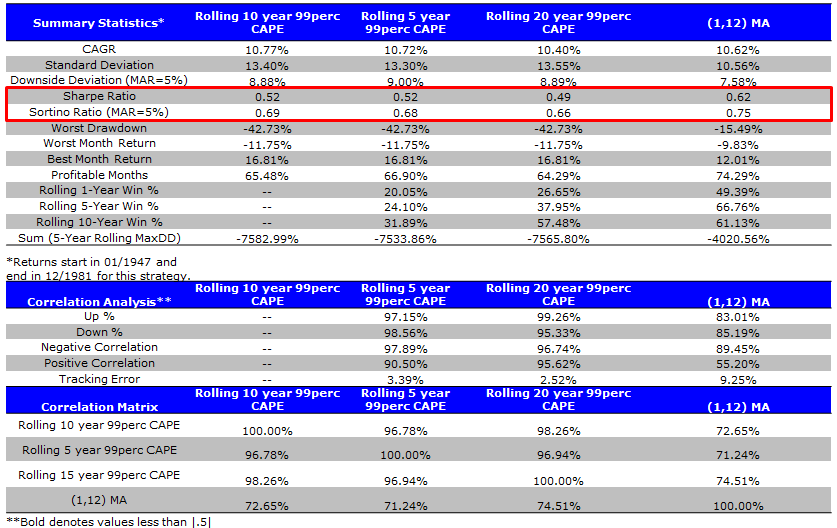
First Half: 1/1/1947 – 12/31/1981
- (1,12) MA outperforms Rolling 10 year Valuation Timing.
- Buy-and-hold is similar to Valuation-Timing.
The results are hypothetical results and are NOT an indicator of future results and do NOT represent returns that any investor actually attained. Indexes are unmanaged, do not reflect management or trading fees, and one cannot invest directly in an index. Additional information regarding the construction of these results is available upon request.
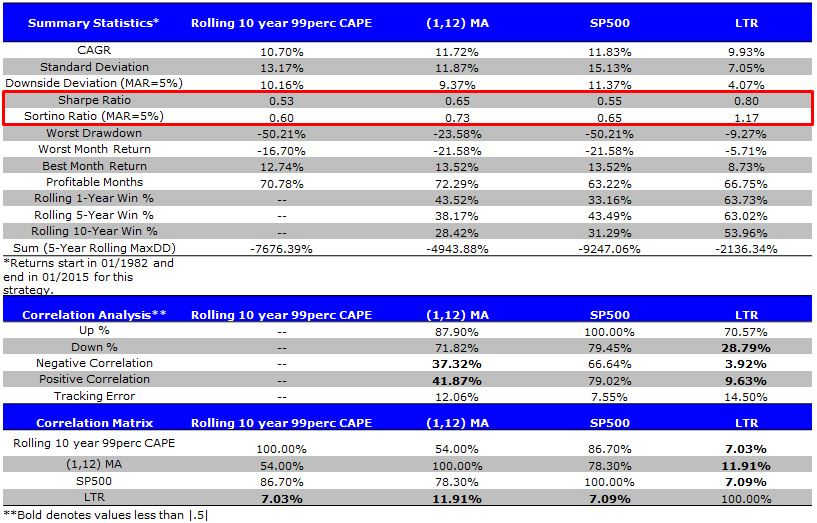
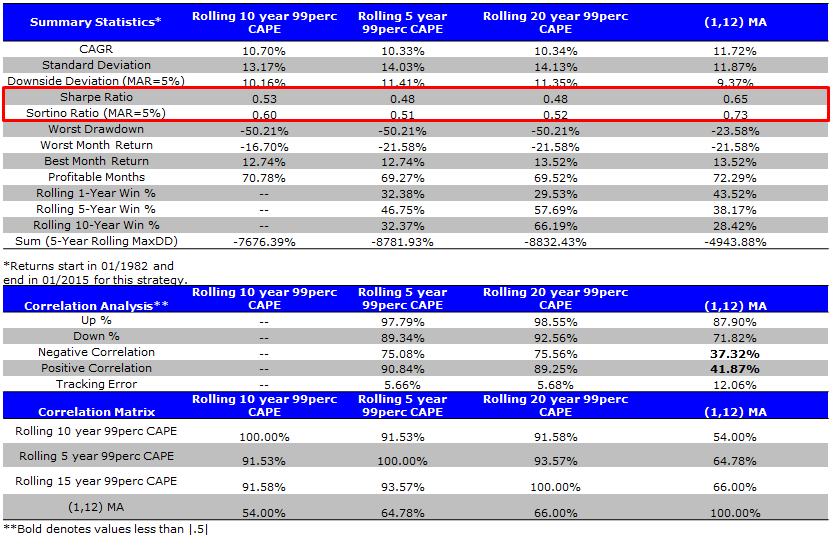
Second Half: 1/1/1982 – 1/31/2015
- (1,12) MA outperforms Rolling 10 year Valuation Timing.
- Buy-and-hold is similar to Valuation-Timing.
The results are hypothetical results and are NOT an indicator of future results and do NOT represent returns that any investor actually attained. Indexes are unmanaged, do not reflect management or trading fees, and one cannot invest directly in an index. Additional information regarding the construction of these results is available upon request.
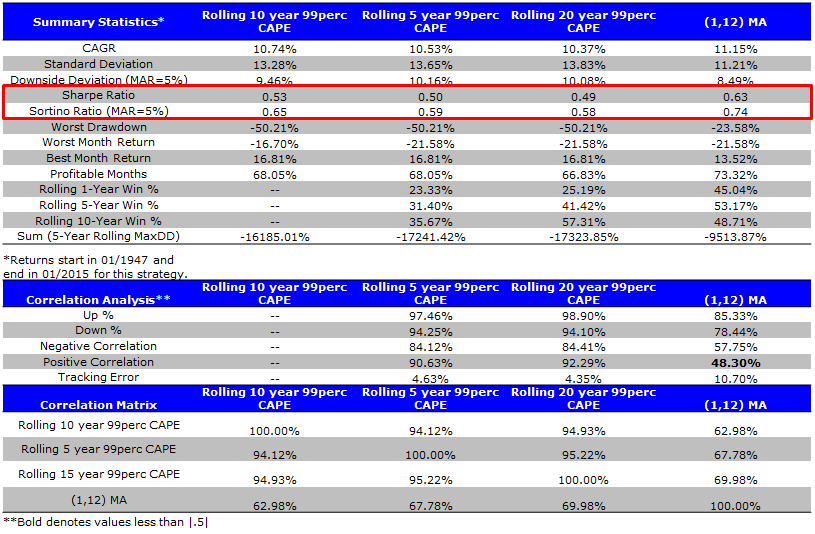
Robustness Tests with Different Look-Back Periods
Full Sample: 1/1/1947 – 1/31/2015
- (1,12) MA outperforms Rolling 5-, 10-, and 20-year Valuation Timing.
- Buy-and-hold is similar to Valuation-Timing.
The results are hypothetical results and are NOT an indicator of future results and do NOT represent returns that any investor actually attained. Indexes are unmanaged, do not reflect management or trading fees, and one cannot invest directly in an index. Additional information regarding the construction of these results is available upon request.
First Half: 1/1/1947 – 12/31/1981
- (1,12) MA outperforms Rolling 5-, 10-, and 20-year Valuation Timing.
- Buy-and-hold is similar to Valuation-Timing.
The results are hypothetical results and are NOT an indicator of future results and do NOT represent returns that any investor actually attained. Indexes are unmanaged, do not reflect management or trading fees, and one cannot invest directly in an index. Additional information regarding the construction of these results is available upon request.
Second Half: 1/1/1982 – 1/31/2015
- (1,12) MA outperforms Rolling 5-, 10-, and 20-year Valuation Timing.
- Buy-and-hold is similar to Valuation-Timing.
The results are hypothetical results and are NOT an indicator of future results and do NOT represent returns that any investor actually attained. Indexes are unmanaged, do not reflect management or trading fees, and one cannot invest directly in an index. Additional information regarding the construction of these results is available upon request.
Robustness Tests with 75 percentile Buy-In Trigger
One issue with a 99th percentile trigger is the possibility that you get out when valuations are at 99th percentile, but when the market drops a bit and hits 98th percentile you get right back in. This might “whipsaw” and create poor outcomes.
To test this conjecture we do another test where we apply the 99th percentile rule, but we don’t get back in to the market until it has dropped to at least the 75th percentile.
FULL SAMPLE: 1/1/1947 – 1/31/2015
- (1,12) MA outperforms Rolling Valuation Timing with a 75th percentile buy-in rule.
- Buy-and-hold is similar to Valuation-Timing.
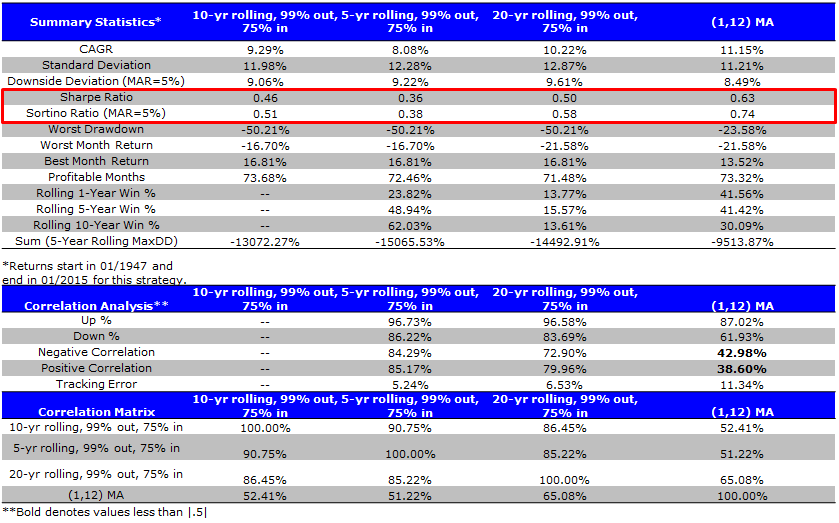
The results are hypothetical results and are NOT an indicator of future results and do NOT represent returns that any investor actually attained. Indexes are unmanaged, do not reflect management or trading fees, and one cannot invest directly in an index. Additional information regarding the construction of these results is available upon request.
FIRST HALF: 1/1/1947 – 12/31/1981
- (1,12) MA outperforms Rolling Valuation Timing with a 75th percentile buy-in rule.
- Buy-and-hold is similar to Valuation-Timing.
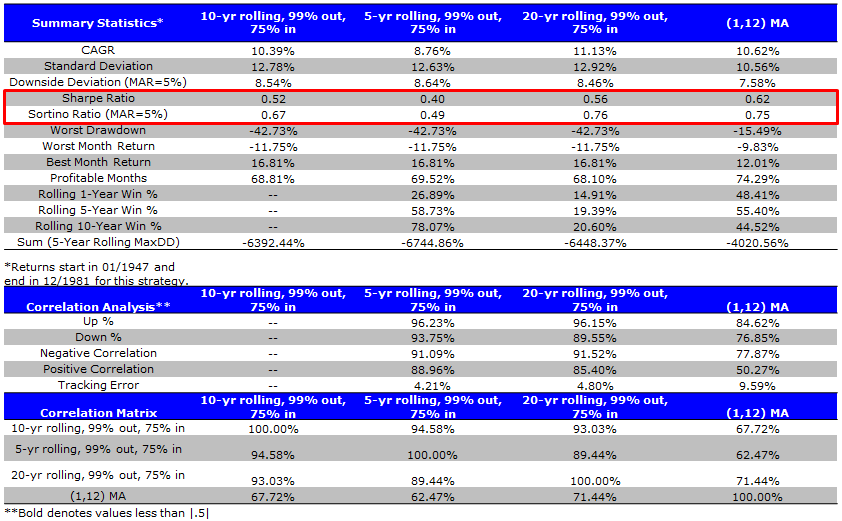
The results are hypothetical results and are NOT an indicator of future results and do NOT represent returns that any investor actually attained. Indexes are unmanaged, do not reflect management or trading fees, and one cannot invest directly in an index. Additional information regarding the construction of these results is available upon request.
SECOND HALF: 1/1/1982 – 1/31/2015
- (1,12) MA outperforms Rolling Valuation Timing with a 75th percentile buy-in rule.
- Buy-and-hold is similar to Valuation-Timing.

The results are hypothetical results and are NOT an indicator of future results and do NOT represent returns that any investor actually attained. Indexes are unmanaged, do not reflect management or trading fees, and one cannot invest directly in an index. Additional information regarding the construction of these results is available upon request.
Conclusion
There is no evidence to support the use of “valuation-timing,” which performs similarly to buy-and-hold strategies (after costs it would we much worse). There is nothing magical about the 99th percentile. Trend-following, at least historically, seems to more effective.
Perhaps there are more convoluted, complex, and data-optimized ways in which we can leverage overall market valuations to help us time markets. We haven’t found any, but that doesn’t mean they don’t exist.
Please share.

About the Author: Wesley Gray, PhD
—
Important Disclosures
For informational and educational purposes only and should not be construed as specific investment, accounting, legal, or tax advice. Certain information is deemed to be reliable, but its accuracy and completeness cannot be guaranteed. Third party information may become outdated or otherwise superseded without notice. Neither the Securities and Exchange Commission (SEC) nor any other federal or state agency has approved, determined the accuracy, or confirmed the adequacy of this article.
The views and opinions expressed herein are those of the author and do not necessarily reflect the views of Alpha Architect, its affiliates or its employees. Our full disclosures are available here. Definitions of common statistics used in our analysis are available here (towards the bottom).
Join thousands of other readers and subscribe to our blog.