A friend of the blog was inspired by our Robust Asset Allocation discussion, and conducted some backtests using our proposed risk management framework:
- 50% simple moving average rule (MA)
- 50% time series momentum rule (TSMOM)
For naming convenience, we call our 50/50 approach ROBUST.
Our friend conducted his analysis on the All Ordinaries Australian Stock Exchange Index (Aussie Index). The data analysis starts in 1984.
The conclusion from the analysis was as follows:
I am dubious as to the value of using these market timing signals…
We have no sacred cows; We simply seek the truth.
We decided to do our own investigation to confirm or deny the findings. At the outset, the sharpe ratios of our risk management concept were slightly worse than old-fashioned buy-and-hold.
Data Details
We look at the following return streams:
- Aussie B&H = Buy-and-Hold Australia Composite index
- Aussie MA = If last month return > Moving average (12 months), go long risky assets; Otherwise, go alternative assets (T-bills)
- Aussie TSMOM = If excess return >0, go long risky assets; Otherwise, go alternative assets (T-bills). (*Excess return = total return over past 12 months less return of T-bill)
- Aussie Robust = The average return of (Aussie MA + Aussie TSMOM)
We apply a 50bps transaction fee to the three timing strategies (MA, TSMOM, and ROBUST). All returns are price returns and do not include the reinvestment of distributions (e.g., dividends). Indexes are unmanaged, do not reflect management or trading fees, and one cannot invest directly in an index. Our sample period is from 9/1/1985 to 1/31/2015.
Summary Statistics:
On a CAGR basis, buy-and-hold is the winner. Also, on a risk-adjusted basis, as conveyed by Sharpe and Sortino ratios, B&H is a winner, but by a small margin. Overall, the results are not compelling for trend-based risk-management systems.
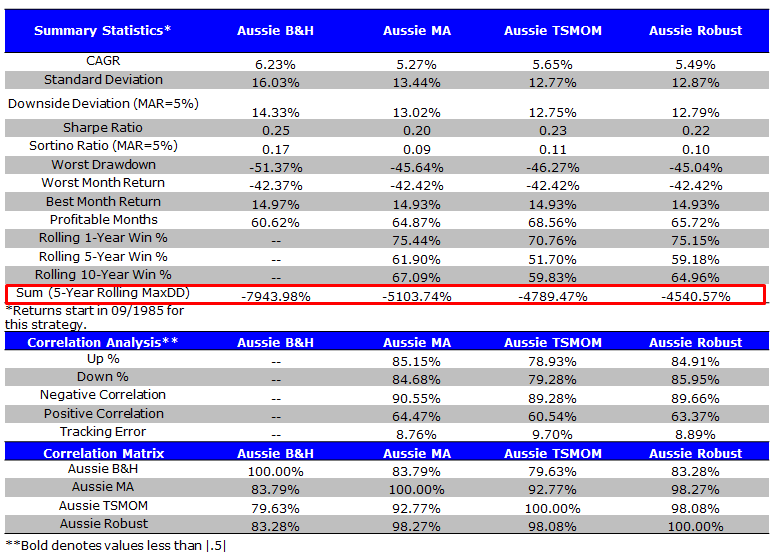
The results are hypothetical results and are NOT an indicator of future results and do NOT represent returns that any investor actually attained. Indexes are unmanaged, do not reflect management or trading fees, and one cannot invest directly in an index. Additional information regarding the construction of these results is available upon request.
Of course, risk-management systems are in place for one reason: to manage risk. There are many ways to manage risk, but often this means lowering volatility, and more importantly, lowering maximum drawdowns and total drawdowns.
The chart above highlights that volatility is lowered and the sum of 5-year rolling drawdowns is much lower for the risk-managed strategies. Max drawdowns are also slightly lower, but not significantly so.
To investigate the risk-management aspects in greater detail, we took a closer look at 5-year rolling drawdowns and historical drawdowns.
5-year Rolling Max Drawdown
As we know, drawdown measures the peak-to-trough decline during a specific record period. 5-year rolling max drawdown measures the peak-to-trough decline during a specific 5-year window.
Why we care about rolling drawdowns?
Well, two strategies can have a similar max drawdown, but one strategy might incur more frequent drawdowns. If our focus in only on max drawdowns, we may miss an important element of the risk profile for a specific strategy.
Below we chart the 5-year rolling MaxDD for all four systems. The drawdown in the first period of the sample is not eliminated via the risk-management rules (akin to the 1987 crash in US equity), but we can see that MA and TSMOM significantly decrease drawdowns over time. Robust provides the best risk-management.
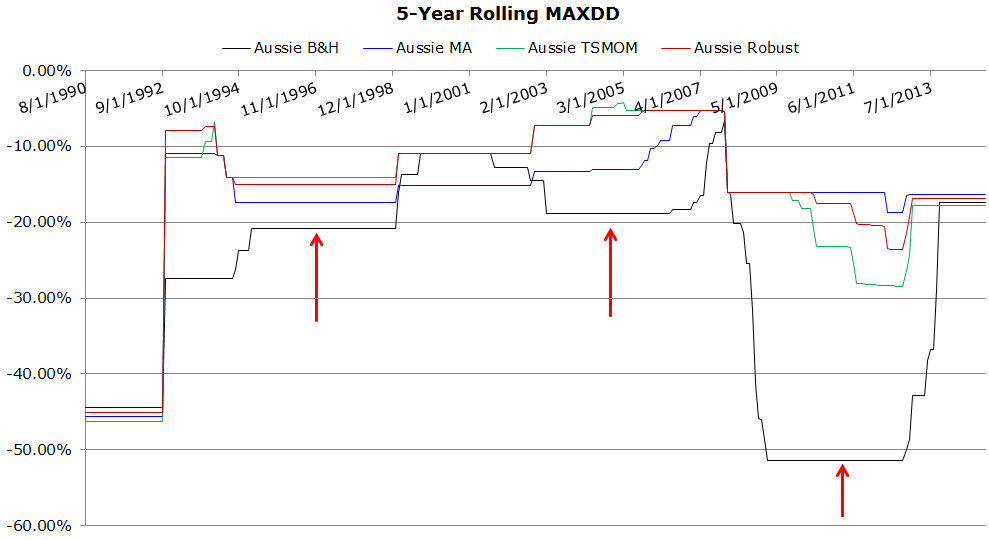
The results are hypothetical results and are NOT an indicator of future results and do NOT represent returns that any investor actually attained. Indexes are unmanaged, do not reflect management or trading fees, and one cannot invest directly in an index. Additional information regarding the construction of these results is available upon request.
Top Drawdowns Comparison
In the table below we outline the drawdowns in the B&H index and show the corresponding drawdowns associated with the risk-managed versions. Aside from the 1987-1988 drawdown, risk-management clearly worked.
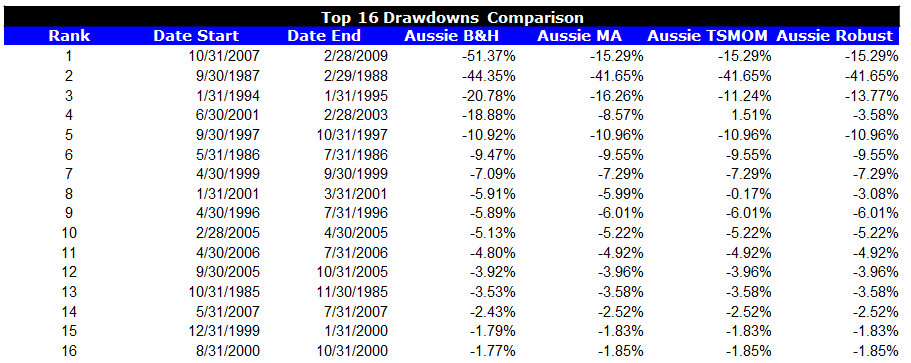
The results are hypothetical results and are NOT an indicator of future results and do NOT represent returns that any investor actually attained. Indexes are unmanaged, do not reflect management or trading fees, and one cannot invest directly in an index. Additional information regarding the construction of these results is available upon request.
Conclusion
At first glance, there is no evidence to suggest that risk-management rules work on the Australian equity market. However, after deeper investigation, there is some evidence to support the notion that risk-management rules do indeed “manage risk” associated with Australian equities.

About the Author: Wesley Gray, PhD
—
Important Disclosures
For informational and educational purposes only and should not be construed as specific investment, accounting, legal, or tax advice. Certain information is deemed to be reliable, but its accuracy and completeness cannot be guaranteed. Third party information may become outdated or otherwise superseded without notice. Neither the Securities and Exchange Commission (SEC) nor any other federal or state agency has approved, determined the accuracy, or confirmed the adequacy of this article.
The views and opinions expressed herein are those of the author and do not necessarily reflect the views of Alpha Architect, its affiliates or its employees. Our full disclosures are available here. Definitions of common statistics used in our analysis are available here (towards the bottom).
Join thousands of other readers and subscribe to our blog.