One of the subtler screens offered at Turnkey Analyst is the Percent Accruals screen. For an excellent review of the “Accrual Anomaly,” take a look at the Turnkey PhD’s excellent blog post.
Now I don’t know about you, but sometimes I find that the Turnkey PhD tends to gear these blog posts for other eggheads, instead of for us mere mortals, who need to have the concept dumbed down a lot further before we can get our non-PhD brains to grasp what he is driving at. So let’s break it down “Barney Style,” or so simplistically that even the purple dinosaur could get it.
If we take a step back, we see that the word “accrue” can mean accumulate, collect, grow, or increase. Accruals apply to all kinds of accounting items, but let’s take a simple accrual example, far removed from PhD-land, to demonstrate how the accruals work and how they can create valuation anomalies.
Let’s say you have two sons, 12 and 14 years old, who mow lawns every spring. During April, May and June, each mows 10 lawns, and then sends out an invoice to each customer that says, “you owe me $10 for mowing services.” (Incidentally, if you know any kids who will mow lawns for $10, please call me).
The two budding capitalists slowly receive payments, and by the end of September, everyone who is going to pay has gotten around to paying his bill. Now let’s say that every year the same thing happens to each kid: two of the neighbors just won’t pay (GAAP accounting has some detailed approaches to this situation, but we’re going to skip those gory details and stick to the big picture)
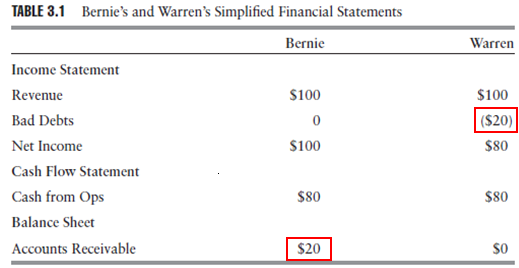
At the end of June, the 12-year old’s simplified income statement shows $100 in Net Income, and his balance sheet shows a $100 Account Receivable. But then by September, something terrible has happened: two customers haven’t paid. And so even though for the six months he is still showing Net Income of $100, he has a remaining A/R of $20, and his cash flow is only $80. Therefore, over the period, NI>CF. Unless he can somehow manage to get those deadbeats to pay up (which, by definition, he can’t), he is going to have to take an Income Statement charge at some point to get rid of those bad debts and clean up his balance sheet. He is just postponing the bad news.
Now let’s say your 14-year old has more business and accounting savvy. You ask him at the end of June how he is doing, but since he is more realistic about what he hopes to make, he tells you that his Net Income is only $80 (having anticipated and already expensed the bad debt). Meanwhile his balance sheet shows an $80 Account Receivable (net of the bad debt). At the end of September, he has already taken his medicine (by expensing the bad debt), has collected his $80, and has a clean balance sheet with no receivables on it. Now the 14-year shows Net Income of $80 and cash flow of $80, and NI=CF. The $80 NI is a good number and represents what the business has made for its owner.
Let’s say you had the chance to buy a 10% interest in either company, and each boy tells you he wants a 10x earnings multiple on his business. So you can buy either A) 10% of the 12-year old’s business for $100 (NI of $100 * 10 * 10% = $100), or B) 10% of the 14-year old’s business for $80 (NI of $80 * 10 * 10% = $80). Which company do you invest in? At this point it should be obvious there is no difference in value between the two businesses, yet because the quality of the 12-year old’s earnings is so low, his Net Income overstates the value of his business.
Of course, there are many ways to game earnings like the 12-year old did to postpone bad news, and bad debt expense is just one, but even so this simple principle of comparing Net Income to Cash Flow captures many of them, and as it turns out is highly predictive of future stock prices. This is known as the “Accrual Anomaly.”
The Turnkey Analyst Percent Accruals screen evaluates accruals and differentiates firms based on the same general earnings quality evaluation we see in the example above. It observes the accruals, or the difference between Net Income and Cash Flow, across the universe of stocks, scales those accruals versus firms’ earnings, and tells you to go long the firms showing the very best relationship between earnings and cash flow. In our example above, the screen would tell you to buy stock in the 14-year old’s company, and steer clear of (or short) the 12-year old’s company.
The Turnkey Percent Accruals screen generates the following stocks:

At this point, a diligent analyst could dig deeper to try to understand why these firms score so well from an accruals perspective, or could look at some more Turnkey Analyst output to assess how the firms stack up against various additional quantitative measures. Even if you just buy a basket of these firms, over the long haul, from a statistical perspective, you are going to be significantly better off than buying the indexes.
About the Author: David Foulke
—
Important Disclosures
For informational and educational purposes only and should not be construed as specific investment, accounting, legal, or tax advice. Certain information is deemed to be reliable, but its accuracy and completeness cannot be guaranteed. Third party information may become outdated or otherwise superseded without notice. Neither the Securities and Exchange Commission (SEC) nor any other federal or state agency has approved, determined the accuracy, or confirmed the adequacy of this article.
The views and opinions expressed herein are those of the author and do not necessarily reflect the views of Alpha Architect, its affiliates or its employees. Our full disclosures are available here. Definitions of common statistics used in our analysis are available here (towards the bottom).
Join thousands of other readers and subscribe to our blog.