Security Analysis, by Graham and Dodd, is a classic text on value investing.
We love it.
And despite our outward “quant” appearance, everything thing we do with Turnkey Analyst has some relation to the fundamental principles and concepts outlined in Security Analysis. We like to consider ourselves “Quantamental,” which is a term I’ve stolen from an anonymous source.
In this piece, we borrow two concepts from two prolific value investors. The first concept is the “Magic Formula,” popularized by Joel Greenblatt. At Turnkey Analyst, we call our system the Magic Score, but the two formulas are interchangeable. This “quality and price” system looks for the best combination of quality and price to determine which stocks are the best value.
Here is how we calculate the Magic Score:
- Calculate earnings before interest and taxes (EBIT) to total enterprise value (TEV) and rank universe
- Calculate EBIT to net property plant and equipment (NPPE) plus net working capital and rank universe
- Average rankings and rank universe
The next concept we borrow is from Graham and Dodd. The basic idea is that the use of “normalized” figures in investment analysis allows an investor to gain an edge on Wall Street, which is solely focused on trailing twelve months and forward looking estimates. Here is a quote from Security Analysis:
The market level of common stocks is governed more by their current earnings than by their long-term average. This fact accounts in good part of the wide fluctuation in common-stock prices, which largely (though by no means invariably) parallel the changes in their earnings between good years and bad. Obviously the stock market is quite irrational in thus varying its valuation of a company proportionately with the temporary changes in its reported profits…This [use of long-term averages] is one of the most important lines of cleavage between Wall Street practice and the canons of ordinary business. Because the speculative public is clearly wrong in its attitude on this point, it would seem that its errors should afford profitable opportunities to the more logically minded to buy common stocks at the low prices occasioned by temporarily reduced earnings and to sell them at inflated prices created by abnormal prosperity.
As part of the Ben Graham faithful, we decided to put his “long-term average” idea to a test and apply this theory to the Magic Score. To conduct this analysis we created a Long-term Magic Score:
- Calculate (8-year average earnings before interest and taxes (EBIT)) to total enterprise value (TEV) and rank universe
- Calculate (8-year average EBIT to net property plant and equipment (NPPE) plus net working capital and rank universe)
- Average rankings and rank universe
The LT Magic Score is completely analogous to the trailing twelve months version, except that the price variable includes a long term average of EBIT divided by TEV and the quality variable is a long term average of the past 8-years of EBIT/capital, instead of just one-year.
Here is how our quick study works:
- Calculate the returns for the standard magic score formula
- Calculate the returns for the long-term magic score formula
- Compare the results
Notes:
- We exclude stocks that are smaller than the 10% percentile market capitalization breakpoint on the NYSE (eliminate microcaps)
- We exclude stocks with average daily value traded less than $1.5mm (adjusted by CPI). (We eliminate illiquid names)
- LTMF=long term magic score
- MF=standard magic score
- All portfolios are equal-weight
- Rebalanced annually
First, a look at the compound annual returns over the 1972 to 2010 period.
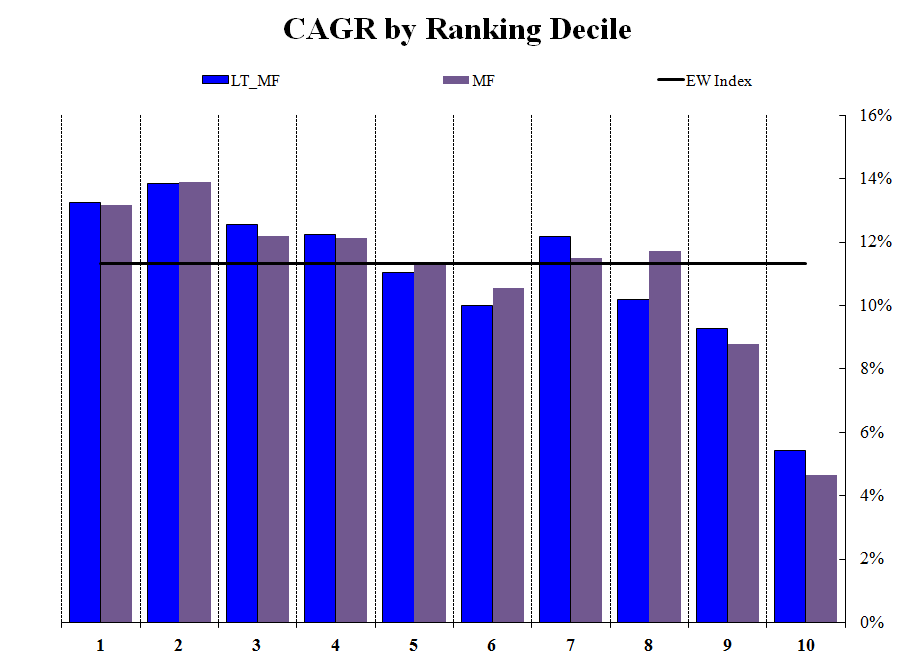
The results are hypothetical results and are NOT an indicator of future results and do NOT represent returns that any investor actually attained. Indexes are unmanaged, do not reflect management or trading fees, and one cannot invest directly in an index. Additional information regarding the construction of these results is available upon request.
Looks like the long-term formula doesn’t add much value.
How about various 10-year holding periods?

The results are hypothetical results and are NOT an indicator of future results and do NOT represent returns that any investor actually attained. Indexes are unmanaged, do not reflect management or trading fees, and one cannot invest directly in an index. Additional information regarding the construction of these results is available upon request.
The long-term formula tends to work early on in the sample, whereas the standard formula outperforms in the latter half of the sample.
How about the risk profile of the strategies?
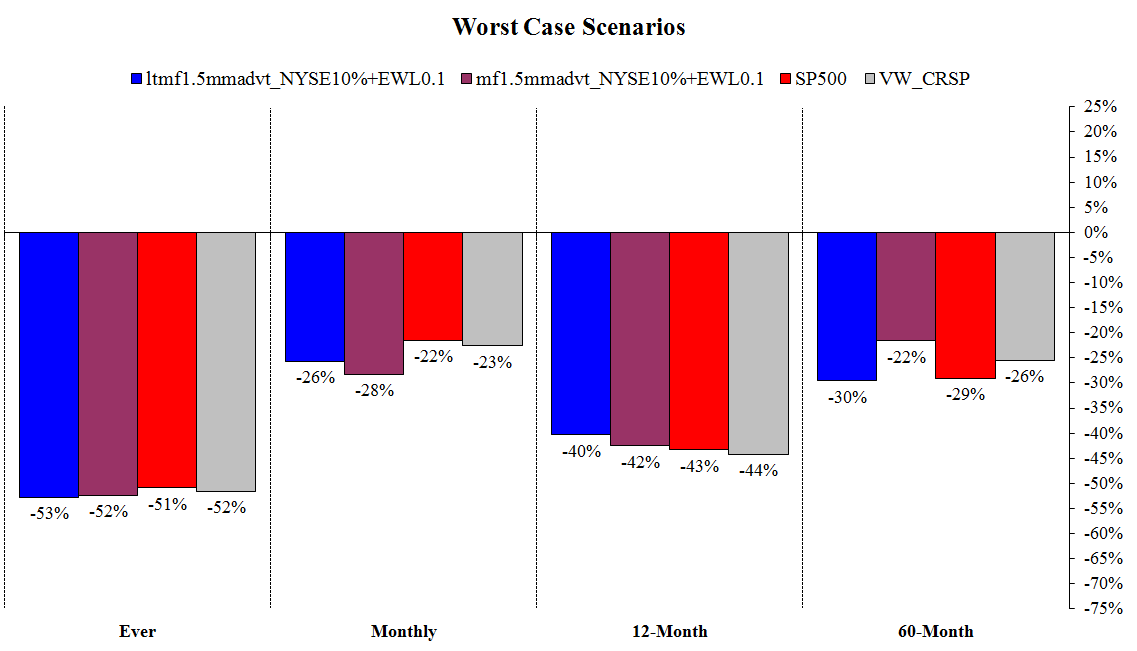
The results are hypothetical results and are NOT an indicator of future results and do NOT represent returns that any investor actually attained. Indexes are unmanaged, do not reflect management or trading fees, and one cannot invest directly in an index. Additional information regarding the construction of these results is available upon request.
Pretty much a wash if you ask me. Maybe with a slight edge to the standard formula.
Finally, what about our standard, and pretty much useless, MBA 101 chart of risk and reward?
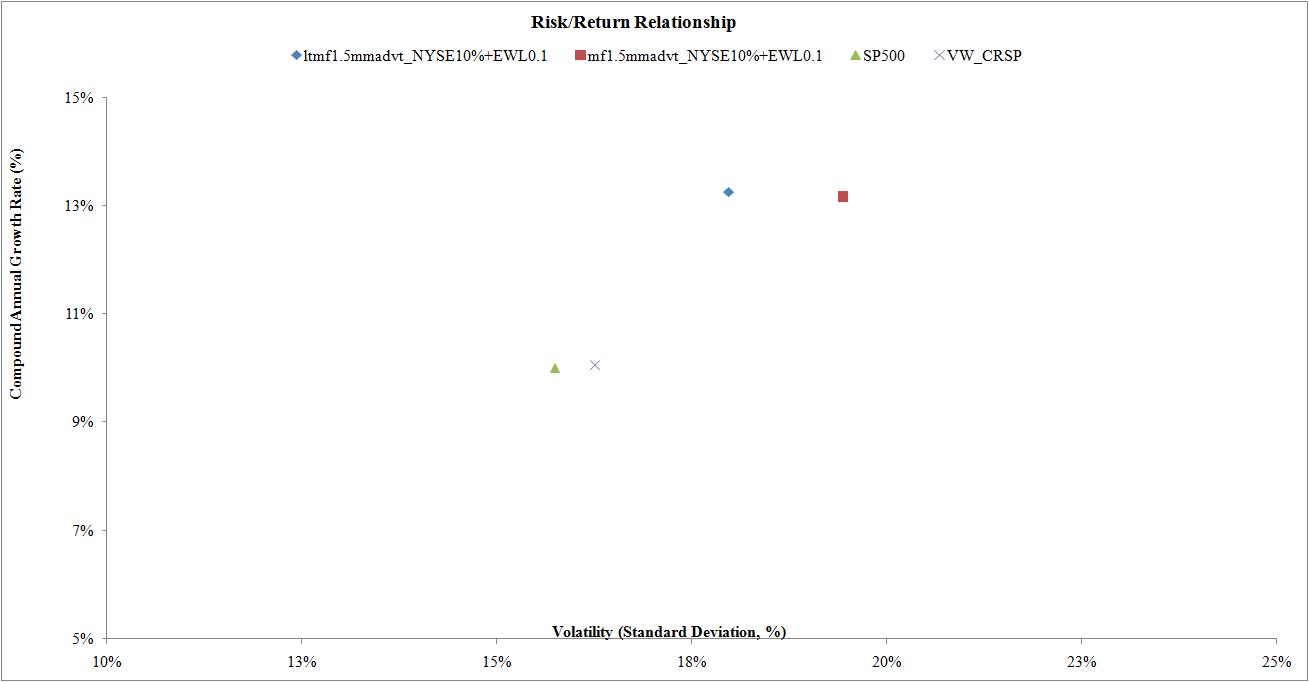
The results are hypothetical results and are NOT an indicator of future results and do NOT represent returns that any investor actually attained. Indexes are unmanaged, do not reflect management or trading fees, and one cannot invest directly in an index. Additional information regarding the construction of these results is available upon request.
Hrm, looks like the long-term formulas might actually add a little value–similar returns, but with less volatility.
Conclusion
In the context of the magic score, Ben Graham’s advice doesn’t ring true. There is some weak evidence that using long-term ratios can lower volatility, but the drawdowns are equivalent. I’d say its a tie, both the standard formula and the long-term formula need to kiss their sisters and shake hands.
About the Author: Wesley Gray, PhD
—
Important Disclosures
For informational and educational purposes only and should not be construed as specific investment, accounting, legal, or tax advice. Certain information is deemed to be reliable, but its accuracy and completeness cannot be guaranteed. Third party information may become outdated or otherwise superseded without notice. Neither the Securities and Exchange Commission (SEC) nor any other federal or state agency has approved, determined the accuracy, or confirmed the adequacy of this article.
The views and opinions expressed herein are those of the author and do not necessarily reflect the views of Alpha Architect, its affiliates or its employees. Our full disclosures are available here. Definitions of common statistics used in our analysis are available here (towards the bottom).
Join thousands of other readers and subscribe to our blog.