Many readers are likely familiar with Ken French’s data:
http://mba.tuck.dartmouth.edu/pages/faculty/ken.french/data_library.html
I’m not sure readers know about other data sources on the web.
Case in point: I’m attaching the Russ Wermer 125 size/value/momo portfolios.
- http://www.rhsmith.umd.edu/faculty/rwermers/ftpsite/Dgtw/coverpage.htm (Homepage)
- http://www.rhsmith.umd.edu/faculty/rwermers/ftpsite/Dgtw/bench%20(2011).csv (raw file)
Here is a cleaned up version already posted in Excel format:
These portfolios represent every quintile cut of size (5x)/value (5x)/mom (5x) and allow you to dial down the historical performance of different combinations.
How do you use these data?
- For example, if you want to see how mid-cap high momentum value stocks perform, grab the size=3, value=5, mom=5 portfolio and can see how that portfolio plays out over time
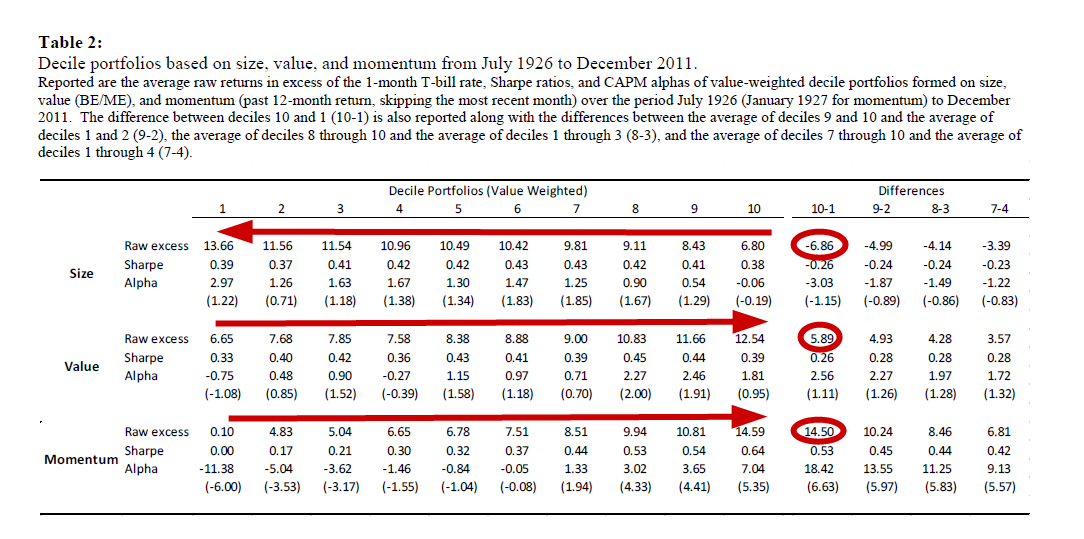
Some stats on value/size/momentum from http://papers.ssrn.com/sol3/papers.cfm?abstract_id=2089466

The results are hypothetical results and are NOT an indicator of future results and do NOT represent returns that any investor actually attained. Indexes are unmanaged, do not reflect management or trading fees, and one cannot invest directly in an index. Additional information regarding the construction of these results is available upon request.
And some numbers:
The results are hypothetical results and are NOT an indicator of future results and do NOT represent returns that any investor actually attained. Indexes are unmanaged, do not reflect management or trading fees, and one cannot invest directly in an index. Additional information regarding the construction of these results is available upon request.
About the Author: Wesley Gray, PhD
—
Important Disclosures
For informational and educational purposes only and should not be construed as specific investment, accounting, legal, or tax advice. Certain information is deemed to be reliable, but its accuracy and completeness cannot be guaranteed. Third party information may become outdated or otherwise superseded without notice. Neither the Securities and Exchange Commission (SEC) nor any other federal or state agency has approved, determined the accuracy, or confirmed the adequacy of this article.
The views and opinions expressed herein are those of the author and do not necessarily reflect the views of Alpha Architect, its affiliates or its employees. Our full disclosures are available here. Definitions of common statistics used in our analysis are available here (towards the bottom).
Join thousands of other readers and subscribe to our blog.