Is Economic Growth Good for Investors?
- Jay R. Ritter
- A version of the paper can be found here.
- Want a summary of academic papers with alpha? Check out our Academic Research Recap Category!
Abstract:
When measured over long periods of time, the correlation of countries’ inflation‐adjusted per capita GDP growth and stock returns is negative. This result holds for both developed countries (for which the correlation coefficient is –0.39 using data from 1900–2011) and emerging markets (the correlation is –0.41 over the period 1988–2011). And this means that investors would have been better off investing in countries with lower per capita GDP growth than in countries experiencing the highest growth rates. This seems surprising since economic growth is generally assumed to be good for corporate profits. In attempting to explain this finding, the author begins by noting that economic growth can be achieved through increased inputs of capital and labor, which don’t necessarily benefit the stockholders of existing companies. Growth also comes from technological advances, which do not necessarily lead to higher profits since competition among firms often results in the benefits accruing to consumers and workers. What’s more, it’s important to recognize that growth has both an expected and an unexpected component. And one explanation for the negative correlation between growth and stock returns is the tendency for investors to overpay for expected growth. But there is another – and in the author’s view, a more important – part of the explanation. Along with the negative correlation between long‐run average stock returns and per capita growth rates, the author also reports a strong positive association between (per share) dividend growth rates and overall stock returns. Such an association is not surprising since unusual growth in dividends is a fairly reliable predictor of increases in future earnings. But another effect at work here is the role of dividends – and, in the U.S., stock repurchases too – in limiting what might be called the corporate “overinvestment problem,” the natural tendency of corporate managers to pursue growth, if necessary at the expense of profitability. One of the main messages of this article is that corporate growth adds value only when companies reinvest their earnings in projects that are expected to earn at least their cost of capital – while at the same time committing to return excess cash and capital to their shareholders through dividends and stock buybacks.
Data Sources:
World Bank; Ritter’s slides:
Alpha Highlight:
Not a strong relationship between real per-capita GDP and equity returns over the long-haul:
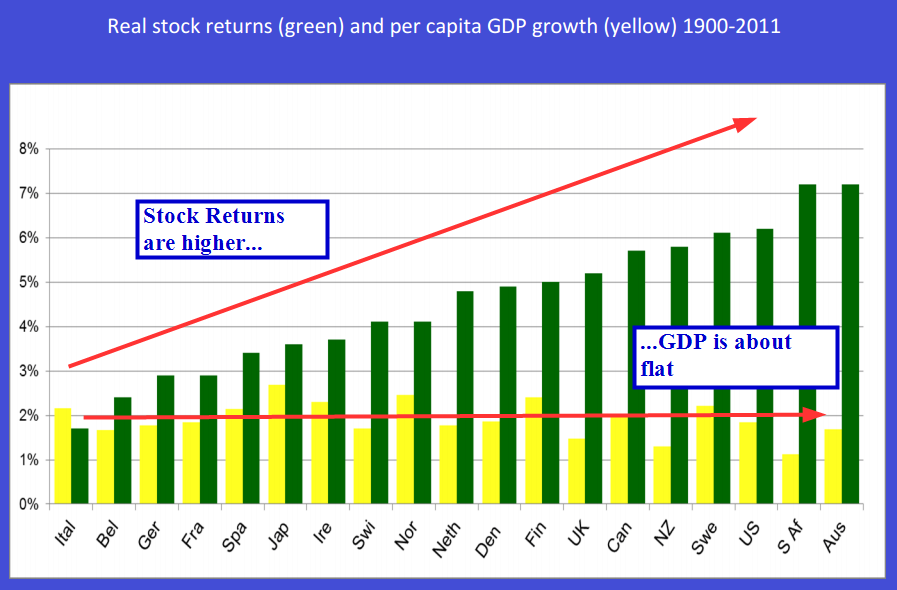
The results are hypothetical results and are NOT an indicator of future results and do NOT represent returns that any investor actually attained. Indexes are unmanaged, do not reflect management or trading fees, and one cannot invest directly in an index. Additional information regarding the construction of these results is available upon request.
Strategy Summary:
- First examines the correlation between real per capita GDP growth and real stock returns for both developed and emerging countries.
- For 19 developed countries from 1900 to 2011, the correlation is -0.39. For 15 emerging countries from 1988 to 2011, the correlation is -0.41.
- From 1970-2012, the correlation between GDP growth and real stock returns has been essentially zero for the 19 developed countries.
- Source of the average long-run stock returns is the Credit Suisse Global Investment Returns Sourcebook 2012.
- Paper also finds a strong association between high dividend growth rates and high overall stock returns.
- For 19 developed countries from 1900 to 2011, the correlation is -0.39. For 15 emerging countries from 1988 to 2011, the correlation is -0.41.
- Some possible explanations for the negative correlation between real stock returns and real per capita GDP growth.
- Tendency of investors to build expectations into prices at the start of the period.
- Many countries have large multinationals, whose operations could plausibly lower the correlation between GDP growth and stock returns.
- Most important (in author’s opinion), is that “stock returns are determined not by growth in economy-wide earnings, but by improvement in measures of firm-specific corporate performance, such as growth in earnings per share and return on equity, that reflect the amount of equity capital contributed by investors and the efficiency with which such capital is used.”
- Payout policy is important, as many firms invest in negative NPV projects.
- U.S. railroad, auto, steel, and airline industries (after initial periods of growth and profitability), show that the returns on reinvested capital (instead of being paid out) proved to be low or even negative, destroying large amounts of shareholder value.
- Four pieces of information needed to estimate future stock returns (in author’s opinion).
- Current P/E ratio, fraction of profits to be paid out to shareholders, return on capital for reinvested earnings, and the probability of catostrophic loss (normal profits are upwardly biased).
Strategy Commentary:
- Interesting paper documenting the negative correlation between stock returns and GDP growth.
- If surveyed, what percentage would believe the opposite? (before reading this paper!)
- Reminds investors that the return on reinvested capital is very important to stock returns
- GM reinvested billions in the 1980s and 1990s (as opposed to paying out the profits), and eventually went bankrupt.
Still Paying Attention to all the Recent Economic Reports?
About the Author: Wesley Gray, PhD
—
Important Disclosures
For informational and educational purposes only and should not be construed as specific investment, accounting, legal, or tax advice. Certain information is deemed to be reliable, but its accuracy and completeness cannot be guaranteed. Third party information may become outdated or otherwise superseded without notice. Neither the Securities and Exchange Commission (SEC) nor any other federal or state agency has approved, determined the accuracy, or confirmed the adequacy of this article.
The views and opinions expressed herein are those of the author and do not necessarily reflect the views of Alpha Architect, its affiliates or its employees. Our full disclosures are available here. Definitions of common statistics used in our analysis are available here (towards the bottom).
Join thousands of other readers and subscribe to our blog.