When Two Anomalies Meet: The Post – Earnings Announcement Drift and the Value – Glamour Anomaly
- Yan and Zhao
- A version of the paper can be found here.
- Want a summary of academic papers with alpha? Check out our Academic Research Recap Category!
Abstract:
This study of the post – earnings announcement drift and the value – glamour anomaly finds that value stocks have greater information uncertainty, exhibit more-muted initial market reactions to earnings surprises, and have better (more positive or less negative) post – earnings announcement drifts than do glamour stocks. A trading strategy based on these findings can generate an average annual abnormal return of 16.6–18.8 percent before transaction costs.
Alpha Highlight:
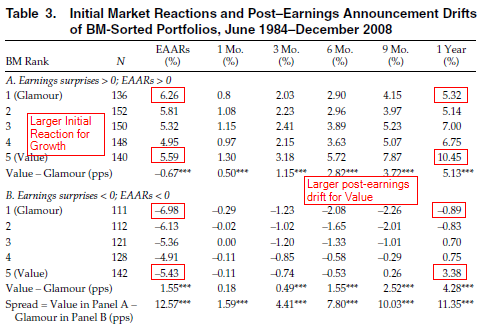
The authors document that earnings surprises produce larger reactions for growth firms compared to value firms (as measured by the earnings announcement abnormal returns – EAAR). This may be due to investors paying more attention to growth firms than value firms. Second, the paper shows that when there is a positive earnings surprise (and positive EAAR), value firms have a larger post-earnings announcement drift. When there is bad news (and a negative EAAR), value firms have better post-earnings announcement drift (less negative).
The results are hypothetical results and are NOT an indicator of future results and do NOT represent returns that any investor actually attained. Indexes are unmanaged, do not reflect management or trading fees, and one cannot invest directly in an index. Additional information regarding the construction of these results is available upon request.
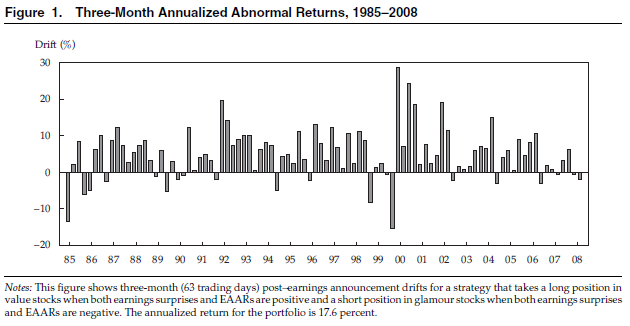
A three-month trading strategy, which goes long value firms with positive earnings surprise and positive EAAR, and short growth firms with a negative earnings surprise and negative EAAR, produces the following returns:
The results are hypothetical results and are NOT an indicator of future results and do NOT represent returns that any investor actually attained. Indexes are unmanaged, do not reflect management or trading fees, and one cannot invest directly in an index. Additional information regarding the construction of these results is available upon request.
The results fit with a behavioral story that investor attention is focused on sexy growth stocks and less focused on boring value firms.
Surprising earnings can be healthy for your portfolio!
About the Author: Jack Vogel, PhD
—
Important Disclosures
For informational and educational purposes only and should not be construed as specific investment, accounting, legal, or tax advice. Certain information is deemed to be reliable, but its accuracy and completeness cannot be guaranteed. Third party information may become outdated or otherwise superseded without notice. Neither the Securities and Exchange Commission (SEC) nor any other federal or state agency has approved, determined the accuracy, or confirmed the adequacy of this article.
The views and opinions expressed herein are those of the author and do not necessarily reflect the views of Alpha Architect, its affiliates or its employees. Our full disclosures are available here. Definitions of common statistics used in our analysis are available here (towards the bottom).
Join thousands of other readers and subscribe to our blog.