The Long and Short of the Vol Anomaly
- Jordan and Riley
- A version of the paper can be found here.
- Want a summary of academic papers with alpha? Check out our Academic Research Recap Category!
Abstract:
On average, stocks with high prior-period volatility underperform those with low prior-period volatility, but that comparison is misleading. As we show, high volatility is an indicator of both positive and negative future abnormal performance. Among high volatility stocks, those with low short interest actually experience extraordinary positive returns, while those with high short interest experience equally extraordinary negative returns. The fact that publicly available information on aggregate short selling can be used to predict positive and negative abnormal returns of great magnitude points to a large-scale market inefficiency. Further, based on the evidence in this study, the current “low vol” investing fad has little or no real foundation.
Alpha Highlight:
The authors remind everyone of the new “fad” in investing: low volatility investing. As other papers show, low volatility investing has outperformed in the past:
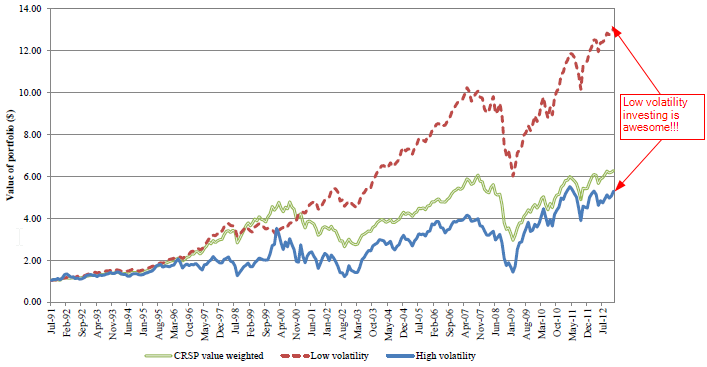
The results are hypothetical results and are NOT an indicator of future results and do NOT represent returns that any investor actually attained. Indexes are unmanaged, do not reflect management or trading fees, and one cannot invest directly in an index. Additional information regarding the construction of these results is available upon request.
However, investors should proceed with caution.
Combining another common measure–short interest for a stock–with volatility produces some intriguing results.
The chart below shows that the best performing portfolio goes long firms with HIGH volatility and low short interest!!!
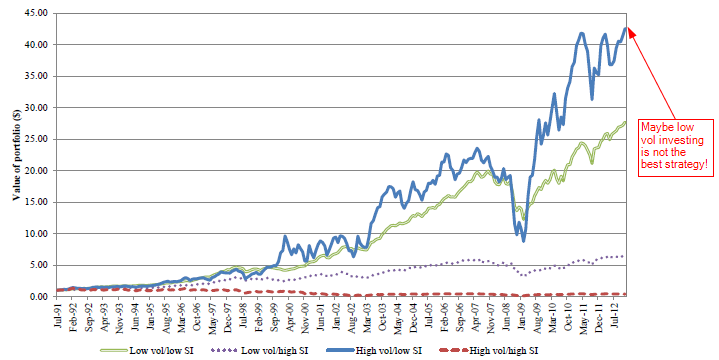
The results are hypothetical results and are NOT an indicator of future results and do NOT represent returns that any investor actually attained. Indexes are unmanaged, do not reflect management or trading fees, and one cannot invest directly in an index. Additional information regarding the construction of these results is available upon request.
Two explanations from the authors to describe these returns:
- Omitted systematic risk factor, or…
- Misvaluation exists and short sellers are good at identifying potential problems on the horizon.
Overall, whenever one variable (short interest) can ruin a strategy (low volatility), it highlights a robustness issue.
Here are some ETFs focused on low/min volatility if you’re interested in who is datamining.
Time to go buy a low volatility ETF?
About the Author: Jack Vogel, PhD
—
Important Disclosures
For informational and educational purposes only and should not be construed as specific investment, accounting, legal, or tax advice. Certain information is deemed to be reliable, but its accuracy and completeness cannot be guaranteed. Third party information may become outdated or otherwise superseded without notice. Neither the Securities and Exchange Commission (SEC) nor any other federal or state agency has approved, determined the accuracy, or confirmed the adequacy of this article.
The views and opinions expressed herein are those of the author and do not necessarily reflect the views of Alpha Architect, its affiliates or its employees. Our full disclosures are available here. Definitions of common statistics used in our analysis are available here (towards the bottom).
Join thousands of other readers and subscribe to our blog.