The traditional small-minus-big value-adjusted long/short factor (SMB) developed by Gene Fama and Ken French has arguably added NO value over time. Performance over the past 30 years has been flat and highly volatile (1983-2013).
The results are hypothetical results and are NOT an indicator of future results and do NOT represent returns that any investor actually attained. Indexes are unmanaged, do not reflect management or trading fees, and one cannot invest directly in an index. Additional information regarding the construction of these results is available upon request.
We create an extreme size value-adjusted factor (E-SMB), which is formed based on quintile splits on size (the original SMB factor is based on median splits). If size is a contributing factor to long-term returns, we should see an even larger premium associated with E-SMB. The data say otherwise: our results show
WORSE performance for E-SMB relative to SMB.
These baseline results question the validity of the “size,” or “small-cap effect.”
Case for a Positive Expected Return Small-Cap Effect
So SMB analysis suggests that size might be “fake.” But why has older research (e.g., Banz’s 1981 Journal of Finance Economics paper) identified a size effect?
Turns out the the devil is in the details.
Older research looks at microcaps and the spread between long portfolios sorted on size. For example, the researchers will compare the performance of a long-only small-cap portfolio and a long-only large-cap portfolio. In more recent work, researchers look at long/short portfolios, or portfolios such as E-SMB and SMB.
Examining long/short portfolios (Fama/French method) produces different insights than comparing long-only portfolios (Banz method).
When one examines the size effect using the techniques used by older research articles (i.e., Banz 1981) there is still a size effect. The data suggest there are large spreads between small firms and large firms. Moreover, even after controlling for value, one can still identify large spreads between small firms and large firms.
What’s the bottomline?
Identifying a size effect depends on the methodology employed!
From the perspective of a buy and hold investor, the size effect is still alive and well.
Intuitively, there should be some premium to buying small-cap stocks due to their limited liquidity and transparency relative to larger firms.
Our Updated Research on the Size Effect
To understand the nuance in the size effect we need to first understand how the Fama/French Factors are constructed.
The Fama/French factors are constructed using the 6 value-weight portfolios formed on size and book-to-market. (See the description of the 6 size/book-to-market portfolios.)
- SMB (Small Minus Big) is the average return on the three small portfolios minus the average return on the three big portfolios.
- NOTE: SMB is not simply small firms minus big firms—there is adjustment that averages the returns for portfolios sorted on value.
- The SMB measure breaks stocks out based on median size, which is a coarse measure.
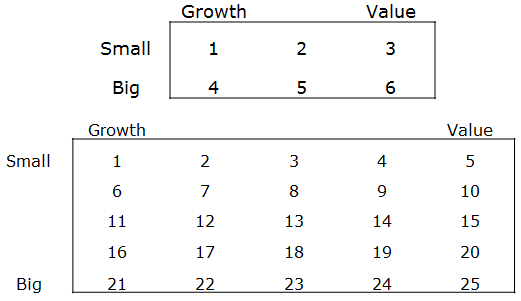
- SMB =1/3 (1+2+3) – 1/3 (4+5+6). (See graphic below)
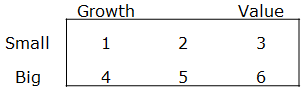
SMB construction chart
- HML (High Minus Low) is the average return on the two value portfolios minus the average return on the two growth portfolios,
- HML =1/2 (Small Value + Big Value) – 1/2 (Small Growth + Big Growth).
- MOM is the average return on the two high prior return portfolios minus the average return on the two low prior return portfolios,
- MOM =1/2 (Small High + Big High) – 1/2(Small Low + Big Low).
- Rm-Rf, the excess return on the market, value-weight return of all CRSP firms incorporated in the US and listed on the NYSE, AMEX, or NASDAQ that have a CRSP share code of 10 or 11 at the beginning of month t, good shares and price data at the beginning of t, and good return data for t minus the one-month Treasury bill rate (from Ibbotson Associates).
- LTR = 10-Year Total Return
–> SMB is a value-adjusted size factor
–> HML is a size-adjusted value factor
–> MOM is a size-adjusted momentum factor
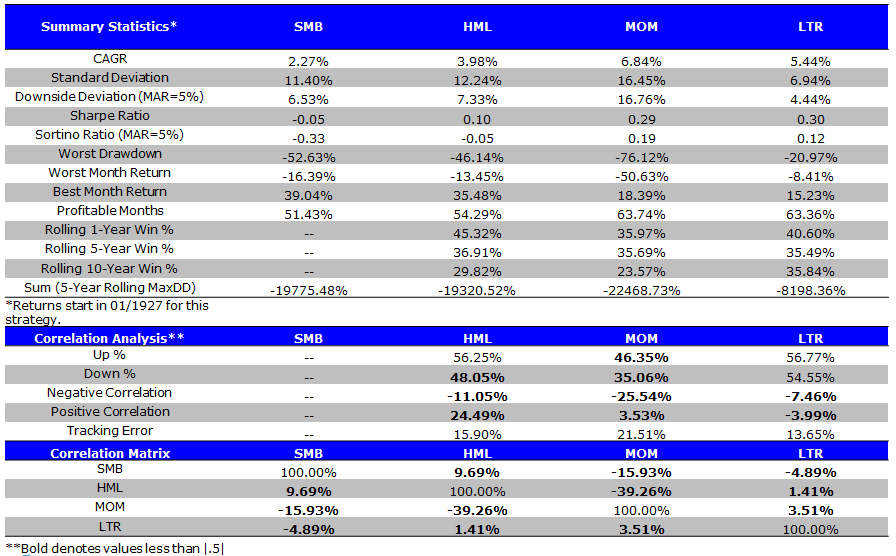
SMB Says Size Doesn’t Matter: (1/1/1927 to 4/30/2014)
Size Factor Summary Statistics
- SMB is the poorest performing factor.
The results are hypothetical results and are NOT an indicator of future results and do NOT represent returns that any investor actually attained. Indexes are unmanaged, do not reflect management or trading fees, and one cannot invest directly in an index. Additional information regarding the construction of these results is available upon request.
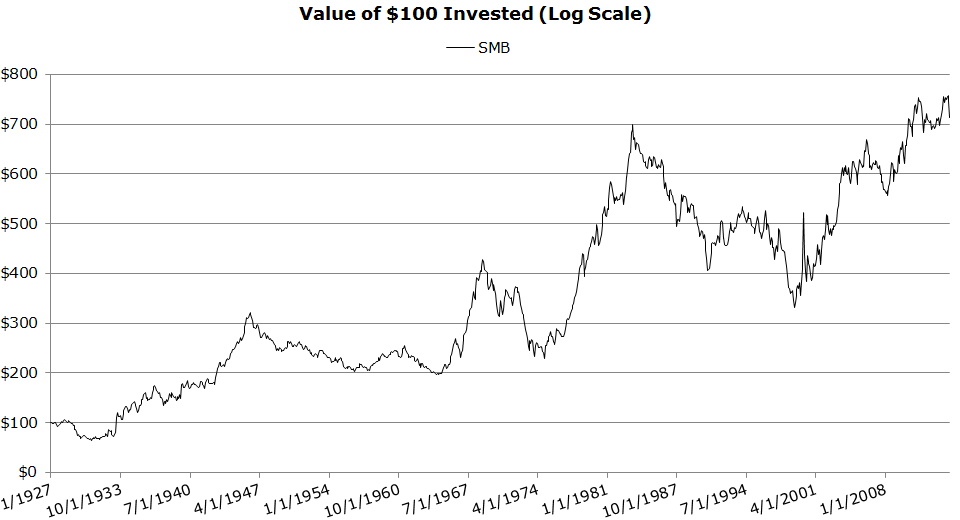
Invested Growth (1/1927 to 4/2014)
- Size has performed over the long-haul, but with extreme volatility.
The results are hypothetical results and are NOT an indicator of future results and do NOT represent returns that any investor actually attained. Indexes are unmanaged, do not reflect management or trading fees, and one cannot invest directly in an index. Additional information regarding the construction of these results is available upon request.
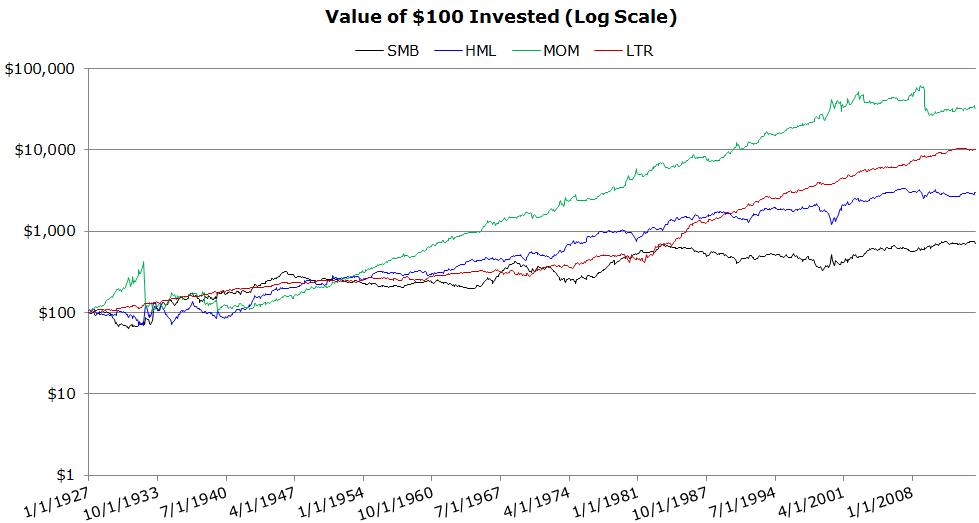
Invested Growth vs. Factors (1/1927 to 4/2014)
- SMB is the worst performing factor.
- MOM incurs extreme drawdowns, or “momentum crashes”
The results are hypothetical results and are NOT an indicator of future results and do NOT represent returns that any investor actually attained. Indexes are unmanaged, do not reflect management or trading fees, and one cannot invest directly in an index. Additional information regarding the construction of these results is available upon request.
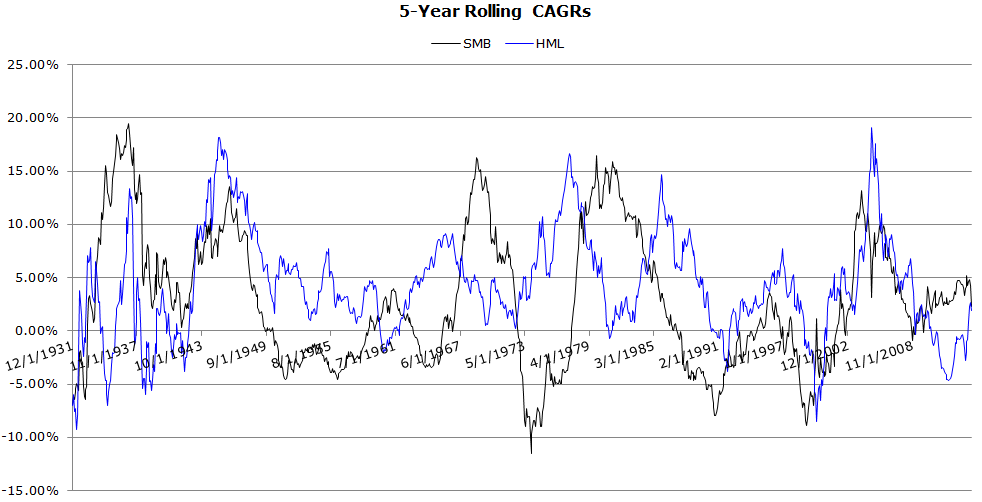
Rolling 5-Year CAGRs (1/1927 to 4/2014)
- Highly cyclical.
- SMB has acted as a hedge for HML at certain times in history (e.g. late 60’s, late 70’s and early 80’s)
The results are hypothetical results and are NOT an indicator of future results and do NOT represent returns that any investor actually attained. Indexes are unmanaged, do not reflect management or trading fees, and one cannot invest directly in an index. Additional information regarding the construction of these results is available upon request.
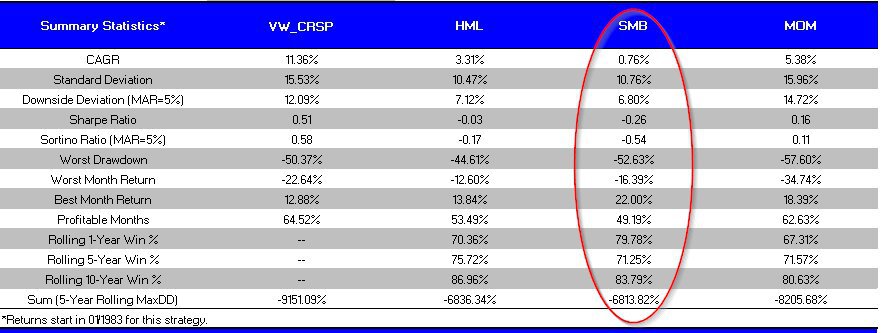
The FF Size Factor (SMB) — Recent 30 Years (10/1/1983 to 4/30/2014)
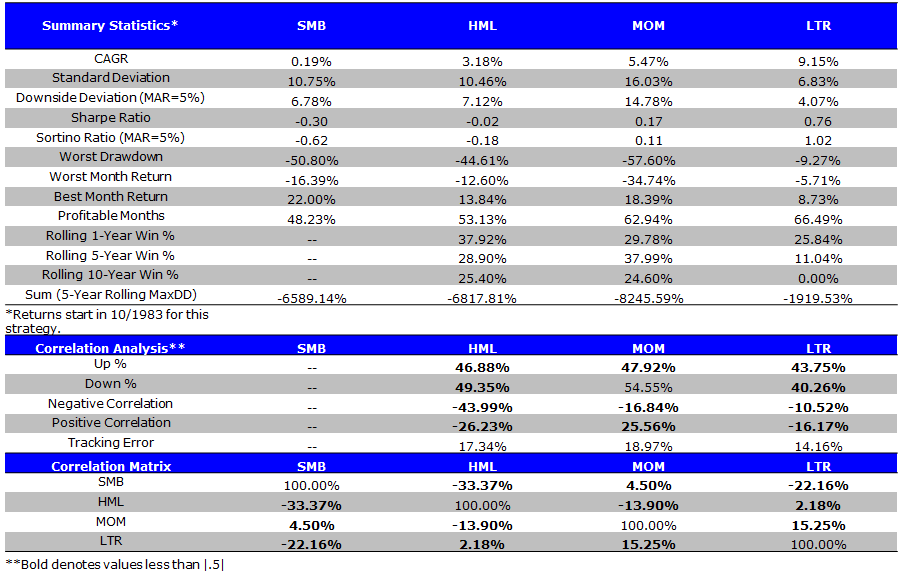
Factor Summary Statistics
- SMB has poor performance.
The results are hypothetical results and are NOT an indicator of future results and do NOT represent returns that any investor actually attained. Indexes are unmanaged, do not reflect management or trading fees, and one cannot invest directly in an index. Additional information regarding the construction of these results is available upon request.
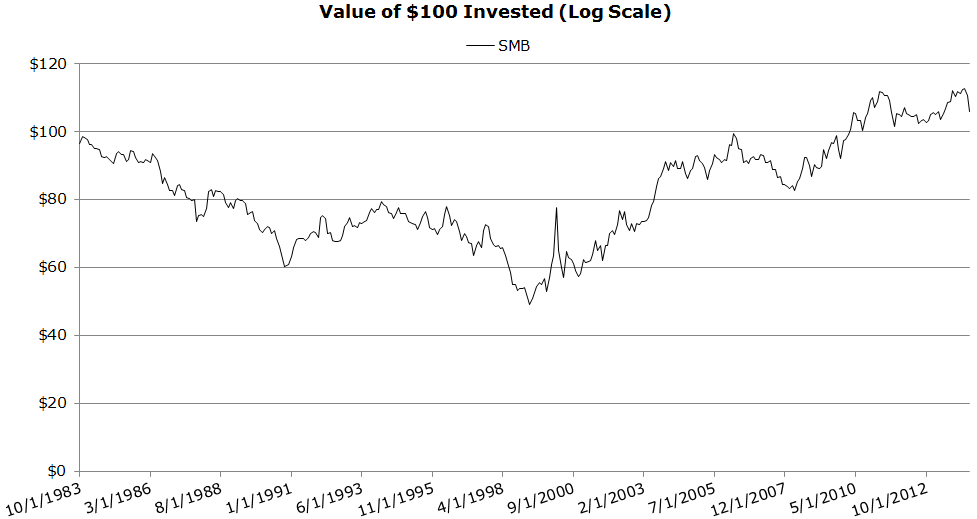
Invested Growth (10/1983 to 4/2014)
- Poor performance over the past 30 years.
The results are hypothetical results and are NOT an indicator of future results and do NOT represent returns that any investor actually attained. Indexes are unmanaged, do not reflect management or trading fees, and one cannot invest directly in an index. Additional information regarding the construction of these results is available upon request.
Invested Growth (10/1983 to 4/2014)
- SMB: the worst performing factor
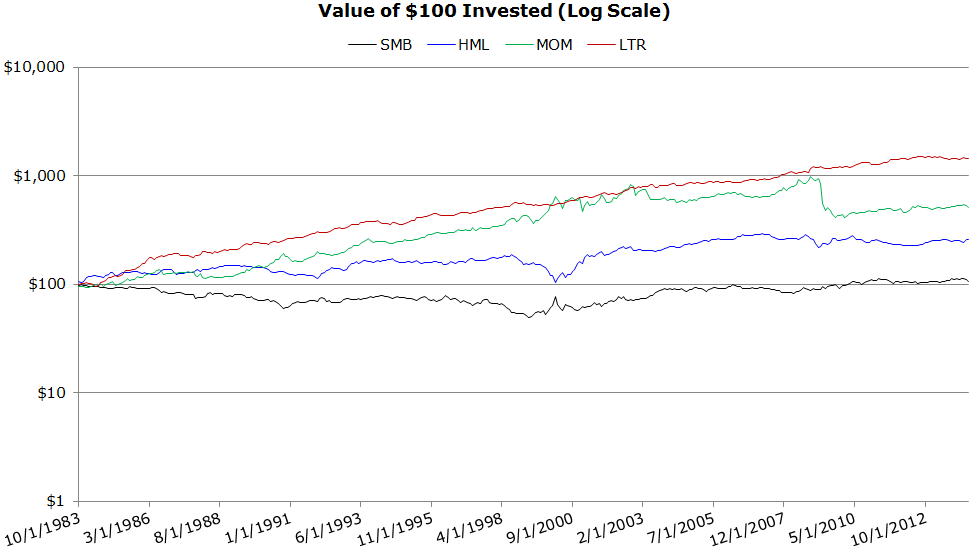
The results are hypothetical results and are NOT an indicator of future results and do NOT represent returns that any investor actually attained. Indexes are unmanaged, do not reflect management or trading fees, and one cannot invest directly in an index. Additional information regarding the construction of these results is available upon request.
Rolling 5-Year CAGRs (10/1983 to 4/2014)
- More correlated to the value factor than in previous periods.
- Highly cyclical.
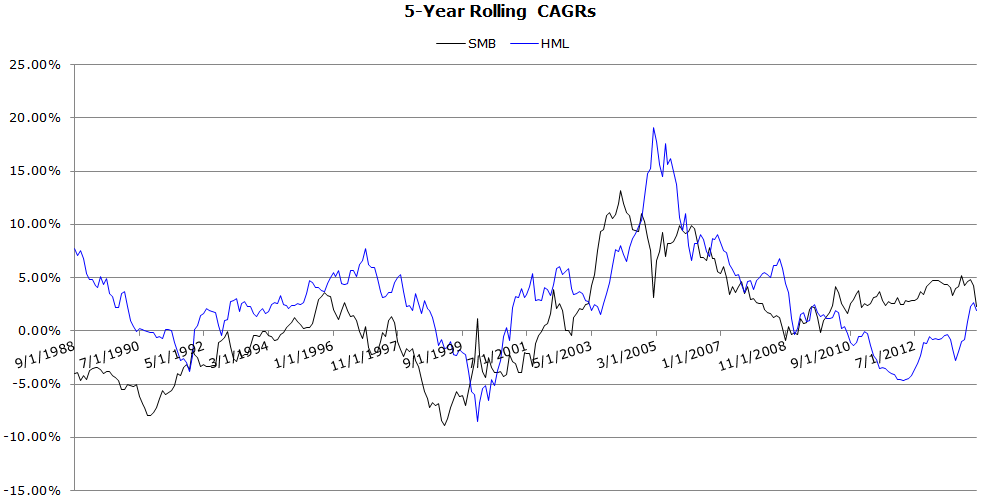
The results are hypothetical results and are NOT an indicator of future results and do NOT represent returns that any investor actually attained. Indexes are unmanaged, do not reflect management or trading fees, and one cannot invest directly in an index. Additional information regarding the construction of these results is available upon request.
The “Extreme” Size Factor (E-SMB) (1/1/1927 to 4/30/2014)
We examine the Fama-French 25 portfolios and construct an “extreme SMB” factor, or E-SMB, which is a more intense version of SMB.
Construction details:
- E-SMB (Small Minus Big) is the average return on the five small portfolios minus the average return on the five big portfolios, E-SMB =1/5 (1+2+3+4+5) – 1/5 (21+22+23+24+25). (See graphic below)
- E-SMB is a value-adjusted extreme size factor
Hypothesis: If the size effect exists, it should be stronger for E-SMB (sorted on size quintiles) relative to SMB (sorted on median size quintile)
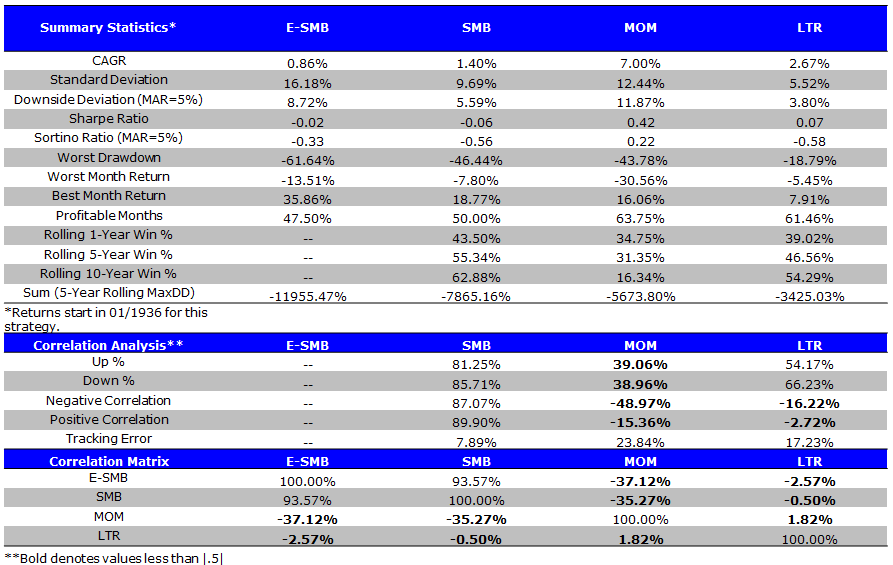
E-SMB Summary Statistics (1/1927 to 4/2014)
- E-SMB has low CAGR and extremely high volatility
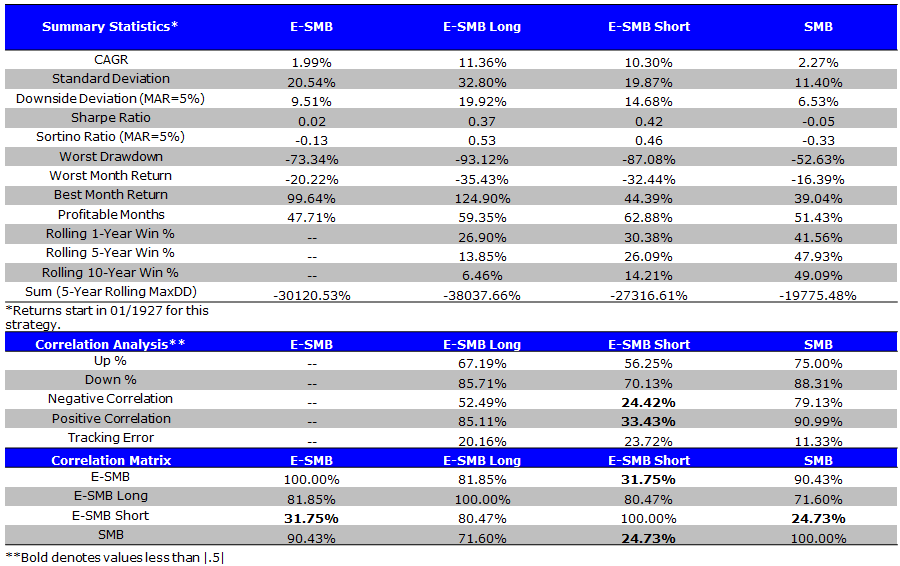
The results are hypothetical results and are NOT an indicator of future results and do NOT represent returns that any investor actually attained. Indexes are unmanaged, do not reflect management or trading fees, and one cannot invest directly in an index. Additional information regarding the construction of these results is available upon request.
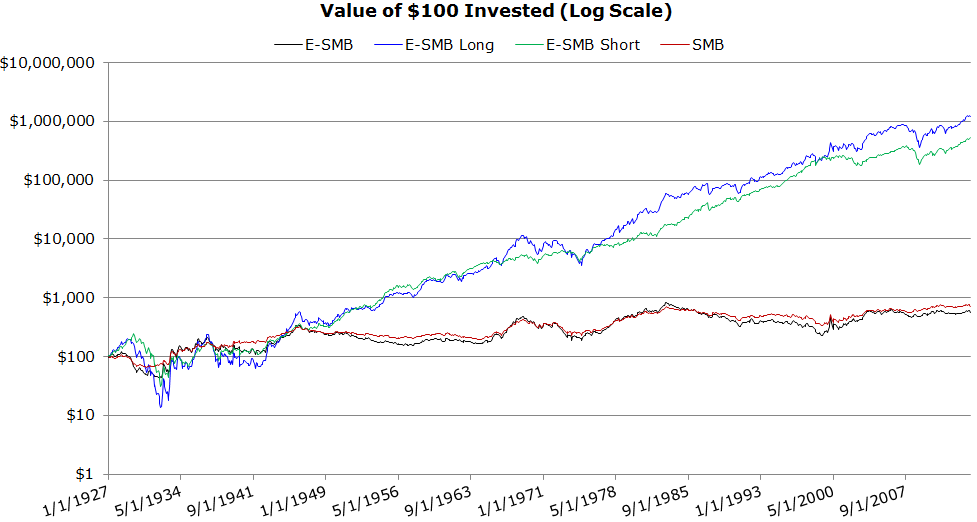
Invested Growth (1/1927 to 4/2014)
- E-SMB and SMB are highly correlated.
- The long leg looks a lot like a high volatility version of the short leg.
The results are hypothetical results and are NOT an indicator of future results and do NOT represent returns that any investor actually attained. Indexes are unmanaged, do not reflect management or trading fees, and one cannot invest directly in an index. Additional information regarding the construction of these results is available upon request.
Investigating if the “Banz” Period is Special for the Size Effect
We examine the period studied by Banz’ in his 1981 Journal of Financial Economics paper, “The Relationship Between Return and Market Value of Common Stocks.” During his testing period (1936-1975) Banz finds strong evidence for a “small-cap” effect. Banz has a unique testing environment that we will discuss later in this report, but for now let’s examine our SMB and E-SMB constructs.
As a reminder:
- SMB (Small Minus Big) is SMB =1/3 (1+2+3) – 1/3 (4+5+6). (See graphic below)
- E-SMB (Small Minus Big) is the average return on the five small portfolios minus the average return on the five big portfolios, E-SMB =1/5 (1+2+3+4+5) – 1/5 (21+22+23+24+25). (See graphic below)
SMB and E-SMB Compared
Factor Summary Statistics (1/1936 to 12/1975)
- E-SMB or SMB are poor long/short portfolios.
The results are hypothetical results and are NOT an indicator of future results and do NOT represent returns that any investor actually attained. Indexes are unmanaged, do not reflect management or trading fees, and one cannot invest directly in an index. Additional information regarding the construction of these results is available upon request.
Size Doesn’t Matter –Was Banz Crazy? Not Quite…
The results from the prior section highlight that SMB and E-SMB don’t paint a pretty picture for the size effect. And yet, Banz claims the size effect is very strong.
What gives?
A deeper look into how Banz conducted his original study on the size effect. A direct quote from the paper:
As an illustration, consider putting equal dollar amounts into portfolios containing the smallest, largest and median-sized firms at the beginning of a year. These portfolios are to be equally weighted and contain, say, ten, twenty or fifty securities. They are to be held for five years and are rebalanced every month. They are levered or unlevered to have the same beta.
Banz’s results in his own words:
The average excess return from holding (ten) very small firms long and very large firms short is, on average, 1.52 percent per month or 19.8 percent on an annualized basis.
So the large difference between large and small caps is generated using 20 firms (10 long, 10 short) as well as leverage (unsure how much). Banz’s approach to identifying the size effect is very different than an approach that looks at the performance of SMB over time.
Through Banz’s research lense, he is correct in stating that there is a significant difference (if you use equal-weighting) between small and large firm returns during the 1936 – 1975 time period.
We dig a little deeper in the analysis that follows and find that the way one weights the portfolios, such as value-weight or equal-weight, has a large impact on the so called “size effect:”
- Value-weighting the portfolios produces a spread between small and large firms of 2.73% and 4.36% for the quintile and decile portfolios, respectively.
- However, equal-weighting the portfolios produces a spread between the small and large firms of 7.19% and 9.98% for the quintile and decile portfolios, respectively.
- Banz was correct in describing the outperformance of small stocks over his time period.
Value-weight (VW) Size Portfolios During the Banz Period (1/1936 to 12/1975)
- Small caps generate outsized returns, but also have extreme volatility.
The results are hypothetical results and are NOT an indicator of future results and do NOT represent returns that any investor actually attained. Indexes are unmanaged, do not reflect management or trading fees, and one cannot invest directly in an index. Additional information regarding the construction of these results is available upon request.
Equal-Weight (EW) Size Portfolios (1/1936 to 12/1975)
- Large CAGR outperformance; large volatility increases.
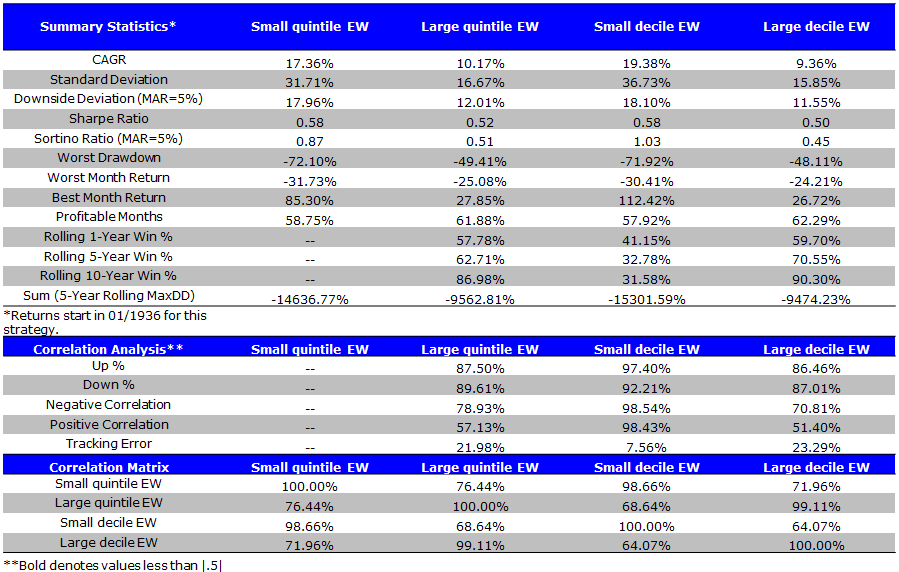
The results are hypothetical results and are NOT an indicator of future results and do NOT represent returns that any investor actually attained. Indexes are unmanaged, do not reflect management or trading fees, and one cannot invest directly in an index. Additional information regarding the construction of these results is available upon request.
Despite what SMB and E-SMB results portray, there are large differences in returns among small stocks and large stocks when viewed via long-only equal-weight concentrated decile portfolios — almost double the CAGR!
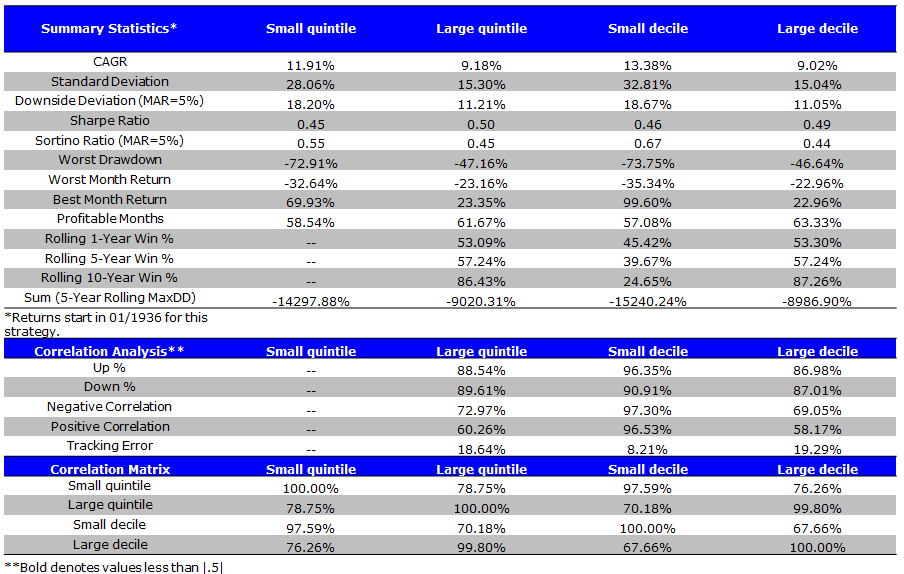
Size Deciles and Quintiles Over the Full Sample Period (1/1/1927 to 4/30/2014)
We look at the returns to small and large quintiles and deciles (NYSE break-points for market capitalization) over the entire time period (1927 – 4/2014).
Simile to the Banz period, the results are driven by VW and EW construction, which makes sense if the size effect matters.
- Value-weighting the portfolios produces a spread between small and large firms of 2.50% and 3.85% for the quintile and decile portfolios, respectively.
- However, equal-weighting the portfolios produces a spread between the small and large firms of 5.97% and 8.53% for the quintile and decile portfolios, respectively.
- Also, the small cap quintile (decile) has a higher Sharpe and Sortino ratio than the large cap quintile (decile) over the entire time period (1927 – 4/2014).
- Thus, equal-weighting the portfolio appears to enhance the “small cap” effect.
VW Size Portfolios (1/1927 to 4/2014)
- A clear size effect for CAGRs.
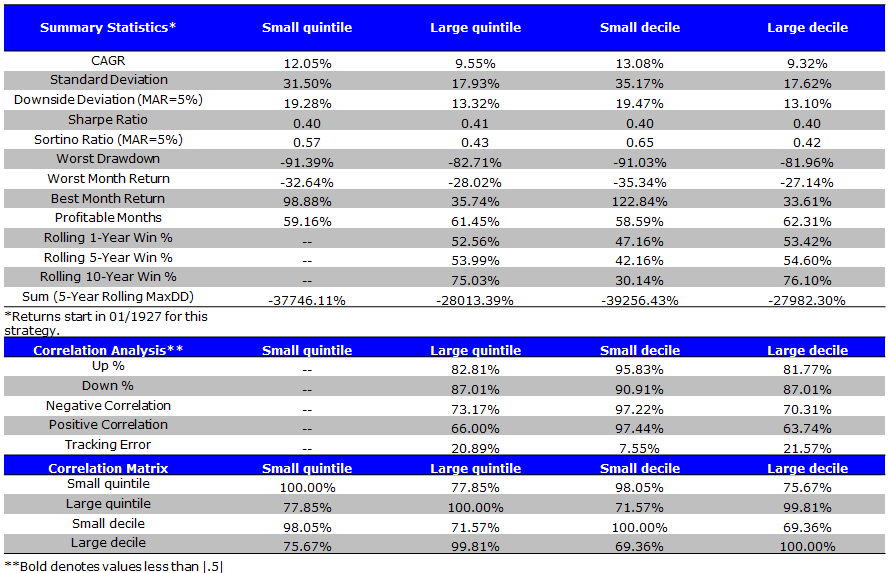
The results are hypothetical results and are NOT an indicator of future results and do NOT represent returns that any investor actually attained. Indexes are unmanaged, do not reflect management or trading fees, and one cannot invest directly in an index. Additional information regarding the construction of these results is available upon request.
EW Size Portfolios (1/1927 to 4/2014)
- Higher CAGR; higher volatility
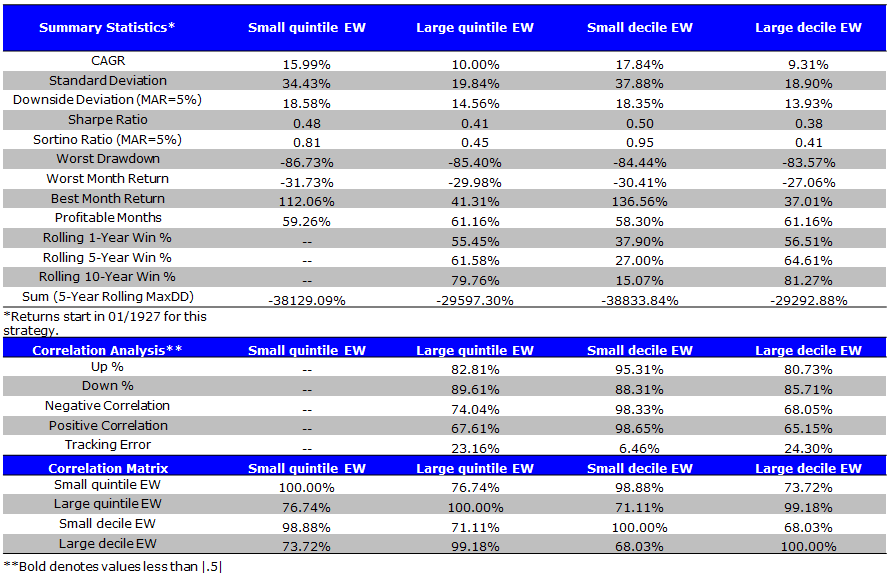
The results are hypothetical results and are NOT an indicator of future results and do NOT represent returns that any investor actually attained. Indexes are unmanaged, do not reflect management or trading fees, and one cannot invest directly in an index. Additional information regarding the construction of these results is available upon request.
Size and Value Interaction (1/1/1927 to 4/30/2014)
Size, without considering valuation, clearly matters for CAGR over the long-haul.
But how does the value effect interact with the size effect?
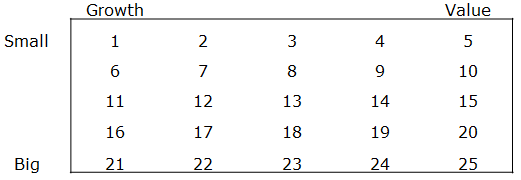
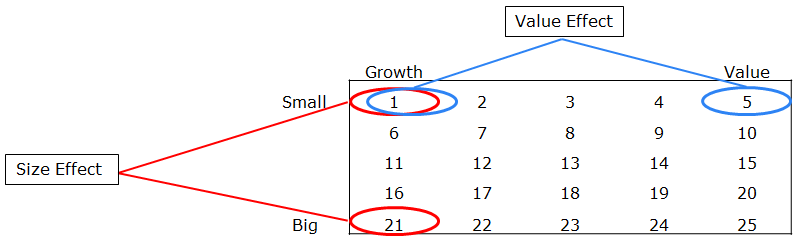
To address this question we examine the Fama-French 25 portfolios. Here is the labeling convention (shown in figure below):
- Small Growth is portfolio 1.
- Small Value is portfolio 5.
- Large Growth is portfolio 21.
- Large Value is portfolio 25.
How to create size portfolios, controlling for value, and how to create value portfolios, controlling for size:
- Identify “size” effect by comparing vertically (control value)
- Identify “value” effect by comparing horizontally (control size)
Explaining the Fama French 25
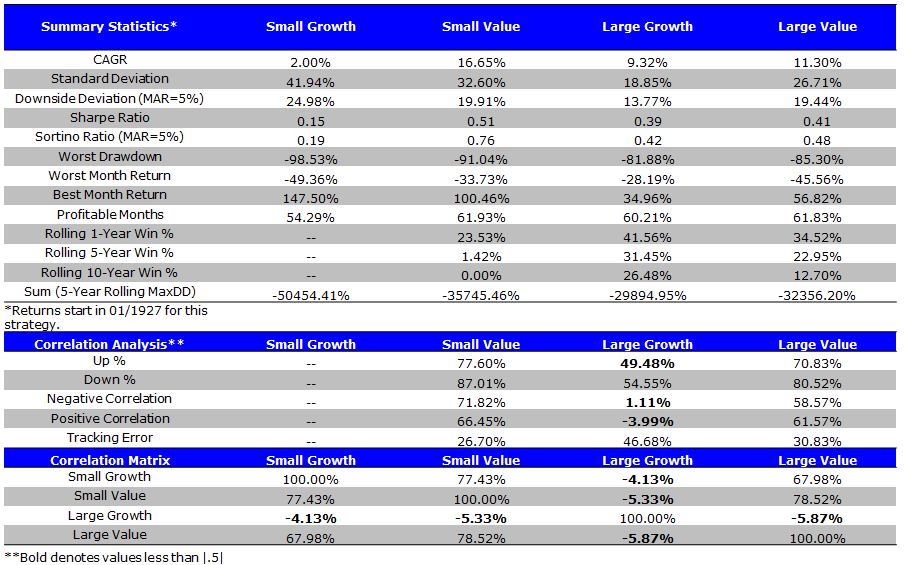
Summary Statistics VW (1/1927 to 4/2014)
- Small value has the strongest performance; SG-LG, SV-LV = Size Effect; LG-LV, SG-SV = Value Effect
- No wonder DFA kicked butt for such a long period!
The results are hypothetical results and are NOT an indicator of future results and do NOT represent returns that any investor actually attained. Indexes are unmanaged, do not reflect management or trading fees, and one cannot invest directly in an index. Additional information regarding the construction of these results is available upon request.
Summary Statistics EW (1/1927 to 4/2014)
- Small value has the strongest performance; SG-LG, SV-LV = Size Effect; LG-LV, SG-SV = Value Effect
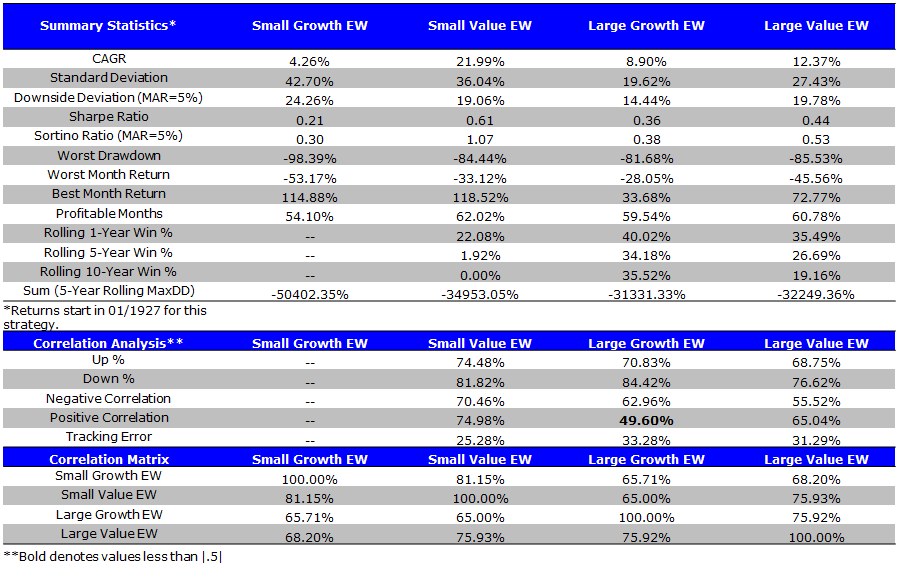
The results are hypothetical results and are NOT an indicator of future results and do NOT represent returns that any investor actually attained. Indexes are unmanaged, do not reflect management or trading fees, and one cannot invest directly in an index. Additional information regarding the construction of these results is available upon request.
Takeaways on size and value interaction
We find that the way you weight the portfolios, such as value-weight or equal-weight, has a large impact on the so called “size effect.”
- Value-weighting the portfolios produces a spread of 14.65% between small value and small growth, and a spread of 1.95% between large value and large growth.
- Equal-weighting the portfolios produces a spread of 17.78% between small value and small growth, and a spread of 3.41% between large value and large growth.
- The spread between value and growth is largest for microcap stocks.
Small Value has the CAGR, Sharpe and Sortino. Also has larger standard deviation than the large cap portfolios.
Bottomline: Size probably matters.
About the Author: Wesley Gray, PhD
—
Important Disclosures
For informational and educational purposes only and should not be construed as specific investment, accounting, legal, or tax advice. Certain information is deemed to be reliable, but its accuracy and completeness cannot be guaranteed. Third party information may become outdated or otherwise superseded without notice. Neither the Securities and Exchange Commission (SEC) nor any other federal or state agency has approved, determined the accuracy, or confirmed the adequacy of this article.
The views and opinions expressed herein are those of the author and do not necessarily reflect the views of Alpha Architect, its affiliates or its employees. Our full disclosures are available here. Definitions of common statistics used in our analysis are available here (towards the bottom).
Join thousands of other readers and subscribe to our blog.