Strategy Background
Beta Rotation strategy (BRS) is discussed by Charles Bilello and Michael Gayed in their new paper, “An International Approach to Beta Rotation: The Strategy, Signal, and Power of Utilities” The paper shows significant rolling out performance over a simple buy and hold strategy of the market throughout multiple time periods. They won the 2014 Charles H. Dow Award based on their research. At the core, the strategy is a simple buy and rotate of utility stocks based on the relative strength of the utility sector:
“When a price ratio (or the relative strength) of the Utilities sector to the broad market is positive over the prior 4-week period, position into Utilities for the following week. When a price ratio (or the relative strength) of the Utilities sector to the broad market is negative over the prior 4-week period, position into the broad market for the following week.”
“In order to achieve a more tactical strategy that is better able to adapt to intra-month volatility, we converted the monthly time frame into a weekly signal.”
We replicate the strategy and put it through a barrage of robustness tests. The results hold up, but are less impressive than those from the original paper (likely due to methodological changes).
As a thought experiment we looked at a long short strategy that maximally exploits any edge the BRS system might have in timing the market. There is no evidence the L/S system works, which suggests the timing model is not overly impressive. Nonetheless, we have never found ANY timing model that is overly impressive.
Overall impression on the timing system: definitely worth a look.
Simulation Background
Simulated Historical Performance: 1/1/1927 to 12/31/2013.
- Instead of using weekly signal, we use monthly signal, which is more practical and serves as a robustness test to the original results.
- Broader stock market index: VW_CRSP
- Utility stock market index: Utilities data from Ken French Data Library
- We back test both BRS Long strategy and BRS Long + short strategy.
- BRS Long Strategy: When the relative strength of the Utilities sector to the broad market is positive over the prior month, position into Utilities for the following month; otherwise, position into broad market for the following month.
- BRS Long + Short strategy: When the relative strength of the Utilities sector to the broad market is positive over the prior month, position into Utilities and short broad market for the following month; otherwise, position into broad market and short Utilities for the following month.
BRS Long Strategy
Summary Statistics:
- The BRS strategy shows some evidence for out performance with higher Sharpe and Sortino ratios.
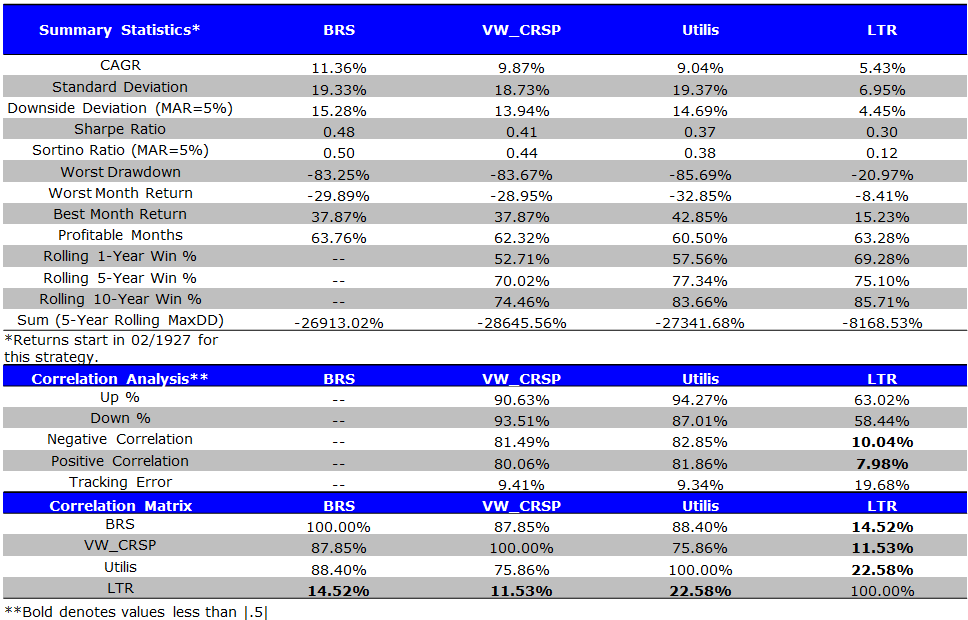
The results are hypothetical results and are NOT an indicator of future results and do NOT represent returns that any investor actually attained. Indexes are unmanaged, do not reflect management or trading fees, and one cannot invest directly in an index. Additional information regarding the construction of these results is available upon request.
Invested Growth:
- Long term out performance
- High correlation with broad market
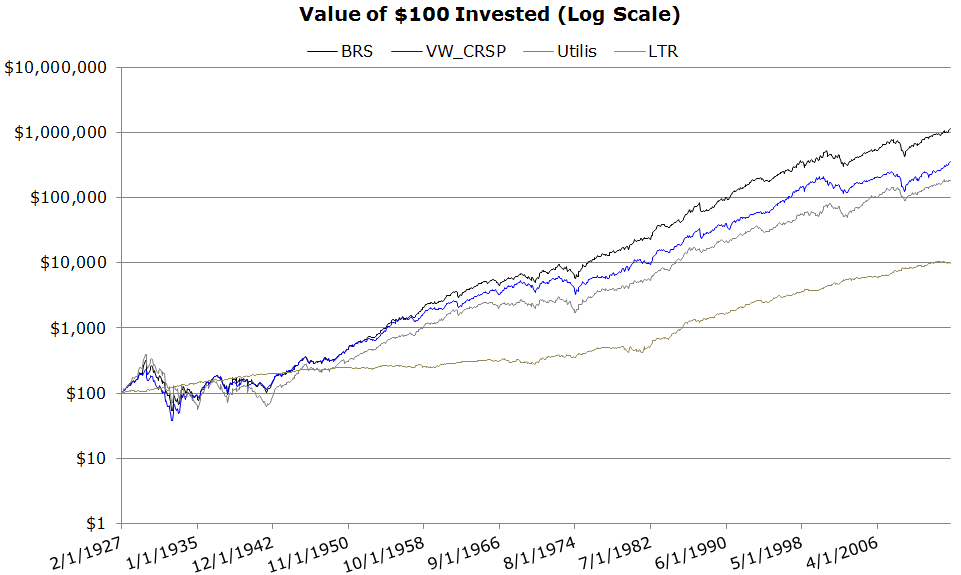
The results are hypothetical results and are NOT an indicator of future results and do NOT represent returns that any investor actually attained. Indexes are unmanaged, do not reflect management or trading fees, and one cannot invest directly in an index. Additional information regarding the construction of these results is available upon request.
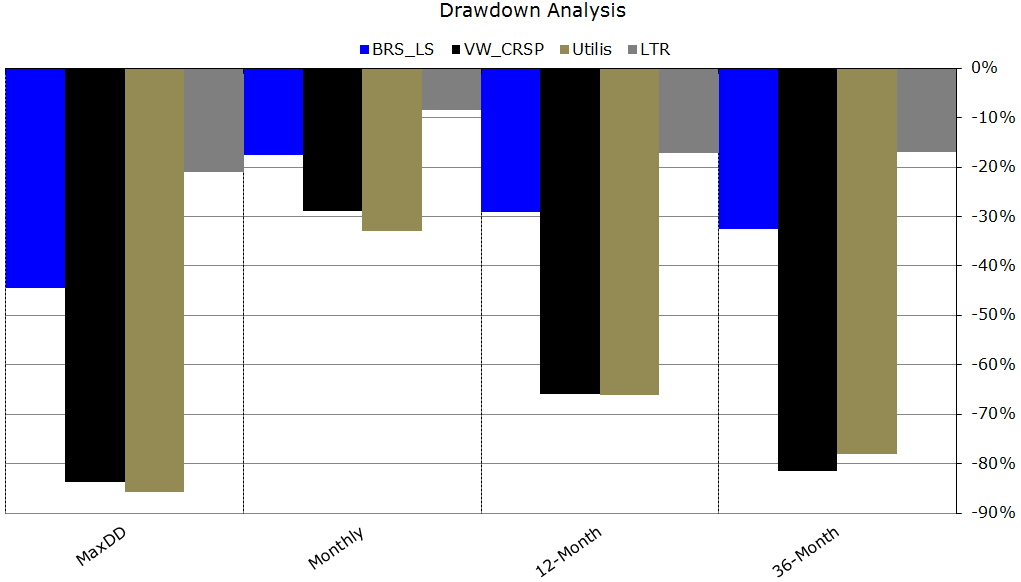
Drawdown Summary:
- Still extremely risky and can suffer large drawdowns
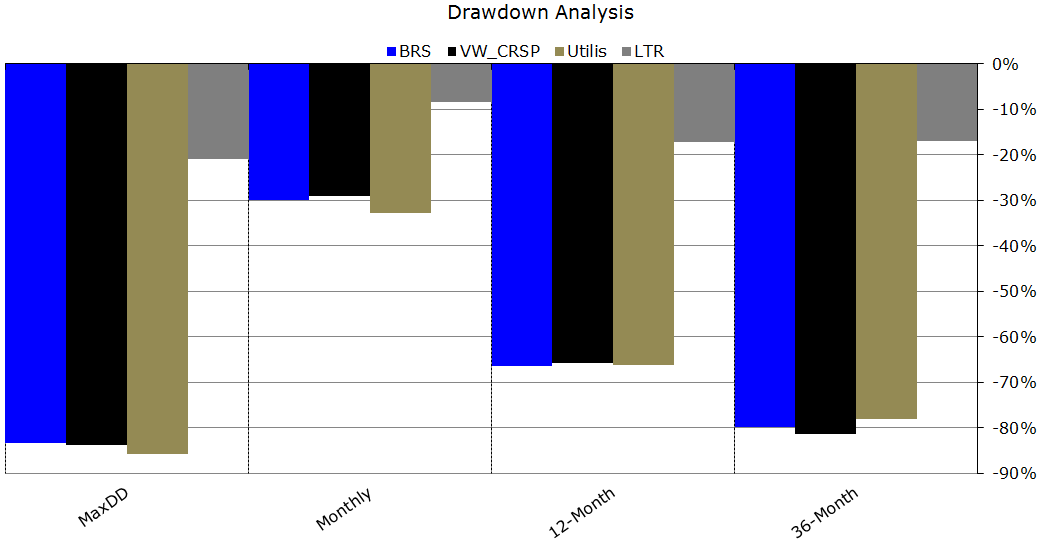
The results are hypothetical results and are NOT an indicator of future results and do NOT represent returns that any investor actually attained. Indexes are unmanaged, do not reflect management or trading fees, and one cannot invest directly in an index. Additional information regarding the construction of these results is available upon request.
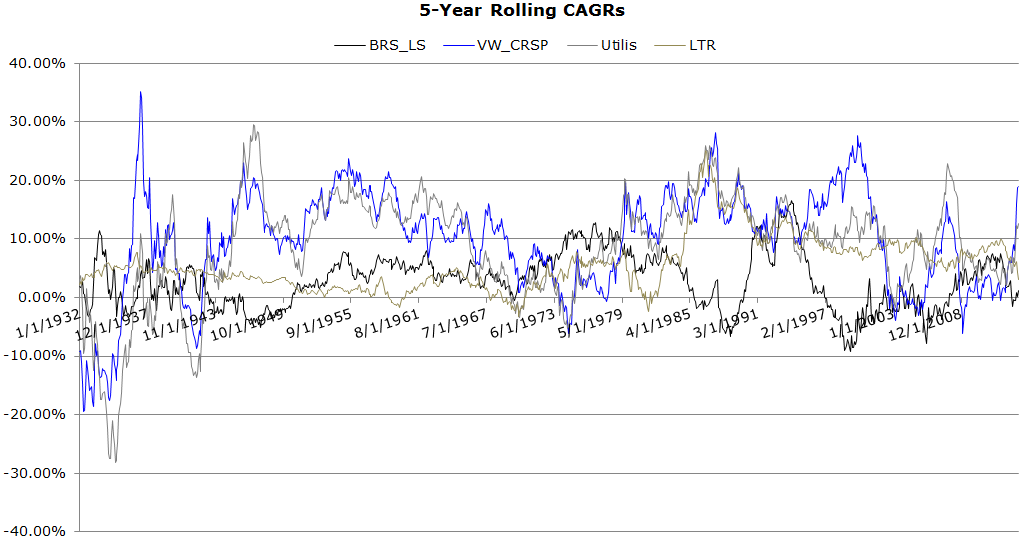
Rolling CAGRs:
- Strong long-term relative performance over 5-year cycles
- 70.02% chance of beating the VW_CRSP over 5-year cycles
- 77.34% chance of beating the utility sector over 5-year cycles
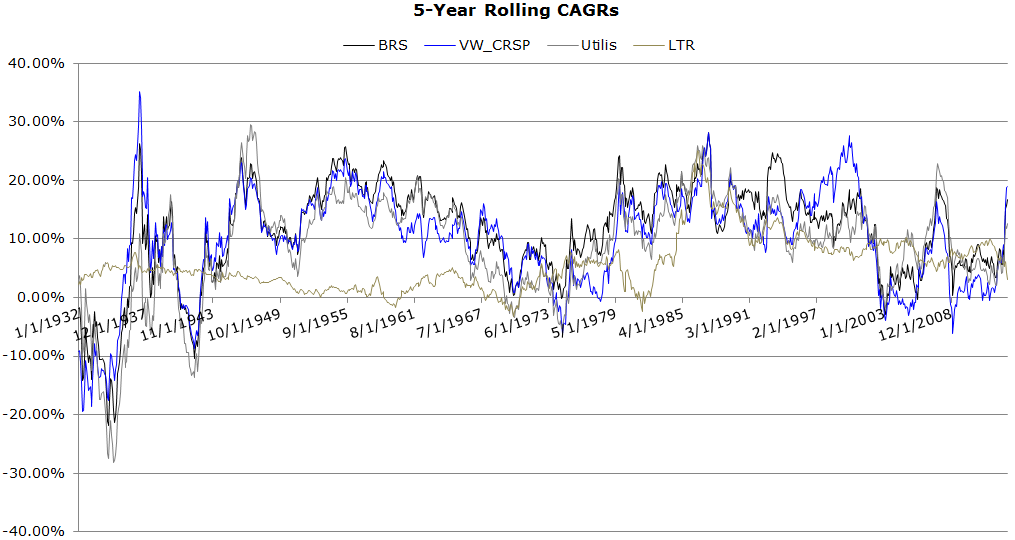
The results are hypothetical results and are NOT an indicator of future results and do NOT represent returns that any investor actually attained. Indexes are unmanaged, do not reflect management or trading fees, and one cannot invest directly in an index. Additional information regarding the construction of these results is available upon request.
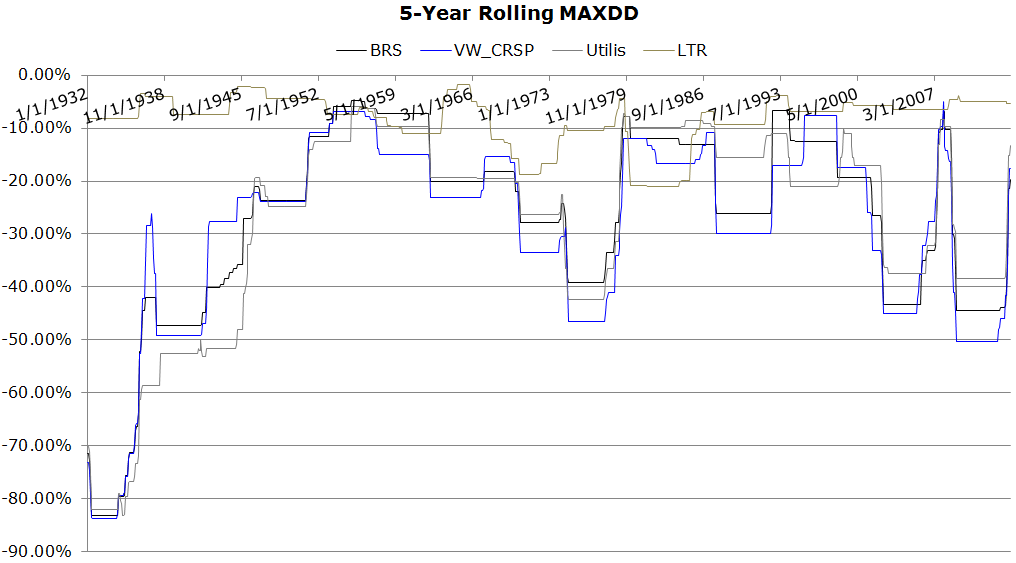
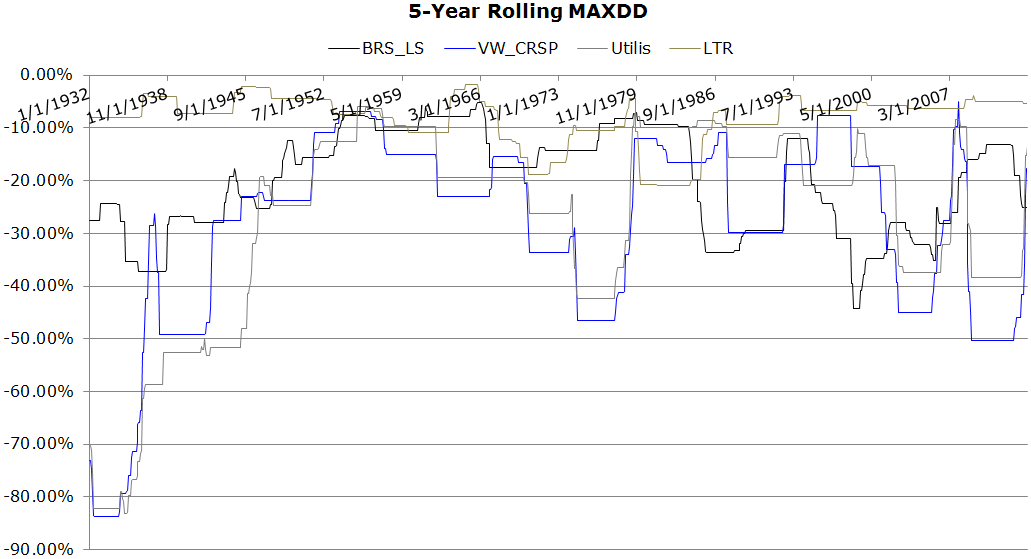
Rolling Drawdowns:
- Correlated drawdown episodes
- Large drawdowns during market downturns
The results are hypothetical results and are NOT an indicator of future results and do NOT represent returns that any investor actually attained. Indexes are unmanaged, do not reflect management or trading fees, and one cannot invest directly in an index. Additional information regarding the construction of these results is available upon request.
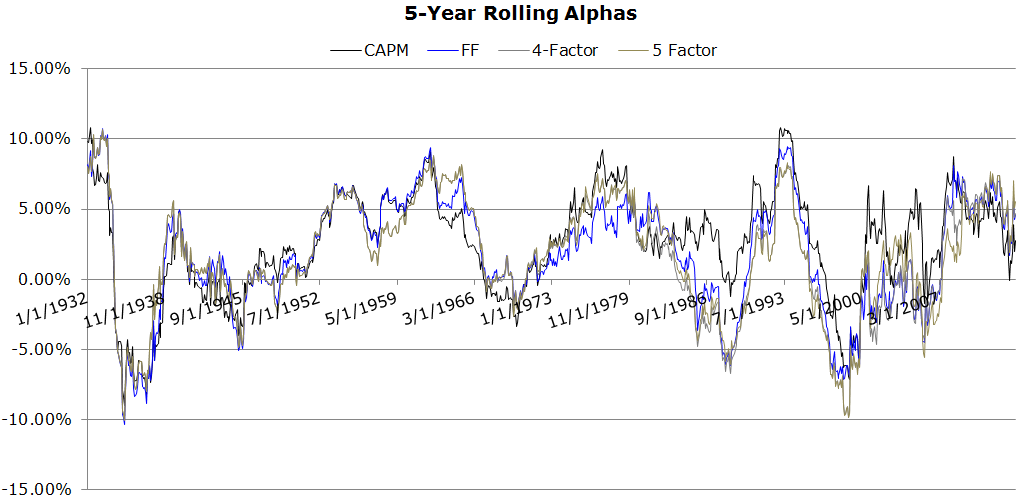
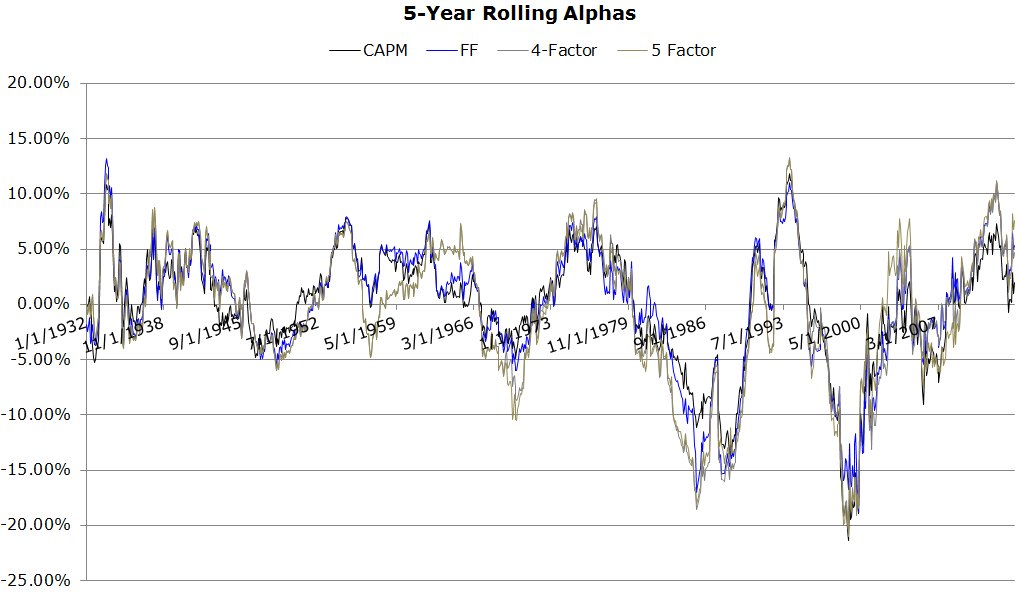
Rolling Alphas:
- No evidence for value-add over time
The results are hypothetical results and are NOT an indicator of future results and do NOT represent returns that any investor actually attained. Indexes are unmanaged, do not reflect management or trading fees, and one cannot invest directly in an index. Additional information regarding the construction of these results is available upon request.
BRS Long+Short Strategy
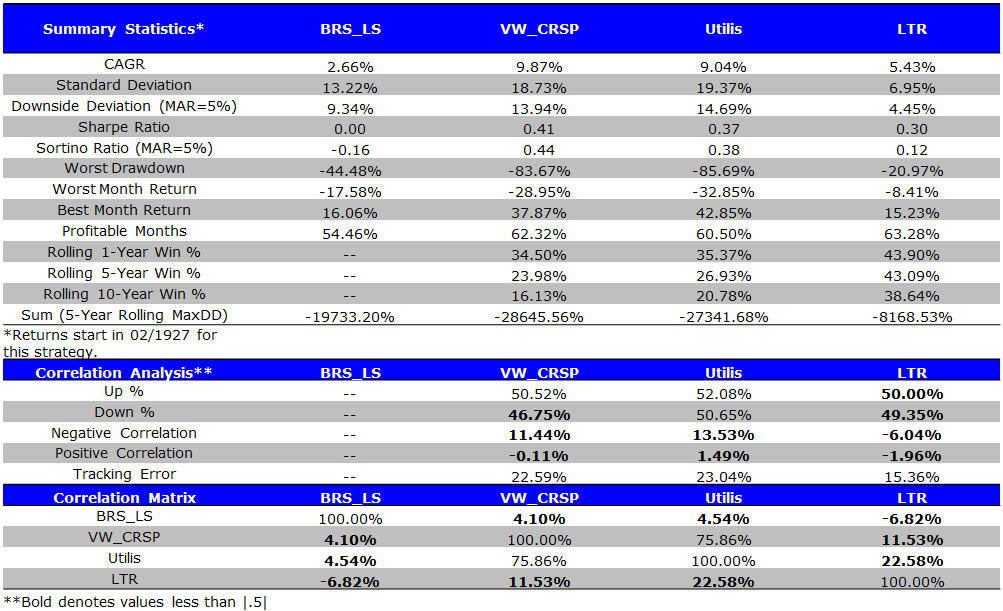
Summary Statistics:
- The BRS Long + Short strategy under performs overall, and is worse than pure buy and hold strategy
- Relatively lower volatility
The results are hypothetical results and are NOT an indicator of future results and do NOT represent returns that any investor actually attained. Indexes are unmanaged, do not reflect management or trading fees, and one cannot invest directly in an index. Additional information regarding the construction of these results is available upon request.
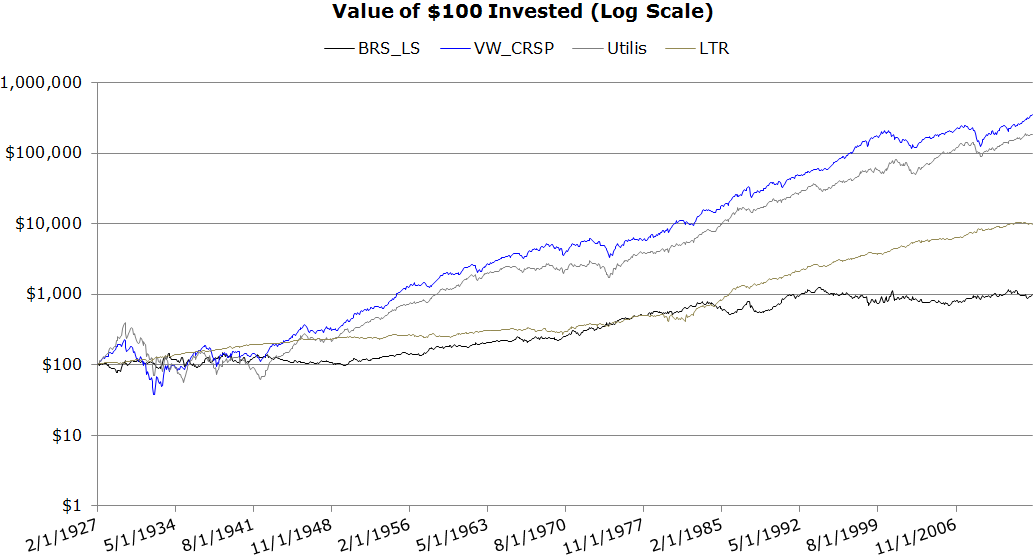
Invested Growth:
- Poor long-term performance
The results are hypothetical results and are NOT an indicator of future results and do NOT represent returns that any investor actually attained. Indexes are unmanaged, do not reflect management or trading fees, and one cannot invest directly in an index. Additional information regarding the construction of these results is available upon request.
Drawdown Summary:
- Less risky than the market because of the hedged nature of the strategy
The results are hypothetical results and are NOT an indicator of future results and do NOT represent returns that any investor actually attained. Indexes are unmanaged, do not reflect management or trading fees, and one cannot invest directly in an index. Additional information regarding the construction of these results is available upon request.
Rolling CAGRs:
- Weak long-term relative performance over 5-year cycles
- Only 23.98% chance of beating the VW_CRSP over 5-year cycles
- Only 26.93% chance of beating utility stocks over 5-year cycles
The results are hypothetical results and are NOT an indicator of future results and do NOT represent returns that any investor actually attained. Indexes are unmanaged, do not reflect management or trading fees, and one cannot invest directly in an index. Additional information regarding the construction of these results is available upon request.
Rolling Drawdowns:
- Non correlated drawdown episodes
- Less affected by market drawdown events
The results are hypothetical results and are NOT an indicator of future results and do NOT represent returns that any investor actually attained. Indexes are unmanaged, do not reflect management or trading fees, and one cannot invest directly in an index. Additional information regarding the construction of these results is available upon request.
Rolling Alphas:
- No evidence for value-add over time
The results are hypothetical results and are NOT an indicator of future results and do NOT represent returns that any investor actually attained. Indexes are unmanaged, do not reflect management or trading fees, and one cannot invest directly in an index. Additional information regarding the construction of these results is available upon request.
About the Author: Wesley Gray, PhD
—
Important Disclosures
For informational and educational purposes only and should not be construed as specific investment, accounting, legal, or tax advice. Certain information is deemed to be reliable, but its accuracy and completeness cannot be guaranteed. Third party information may become outdated or otherwise superseded without notice. Neither the Securities and Exchange Commission (SEC) nor any other federal or state agency has approved, determined the accuracy, or confirmed the adequacy of this article.
The views and opinions expressed herein are those of the author and do not necessarily reflect the views of Alpha Architect, its affiliates or its employees. Our full disclosures are available here. Definitions of common statistics used in our analysis are available here (towards the bottom).
Join thousands of other readers and subscribe to our blog.