“How many stocks should I own in my portfolio?”
This question is actually quite complex and doesn’t have a clear answer.
To better understand the costs and benefits of more or less stocks in a portfolio we explore the trade-off between diversification and alpha generation.
Here is a high level summary of the situation:
- Owning more stocks in a portfolio lowers “idiosyncratic” risk, or risk that can be eliminated through diversification, however…
- Owning more stocks dilutes performance of an “alpha” generating process. (e.g., forcing Warren Buffett to hold a 500 stock equal-weighted portfolio would dampen his alpha)
In summary, fewer stocks in a portfolio imply more expected alpha and more idiosyncratic risk; more stocks in a portfolio imply less expected alpha and less idiosyncratic risk.
But what is the optimal trade-off between alpha and idiosyncratic risk? Do we want to own a 1 stock portfolio? A 50 stock portfolio? Or a 1000 stock portfolio?
Understanding Idiosyncratic Risk
Let’s first tackle idiosyncratic risk.
Idiosyncratic risk is the risk we can eliminate via diversification. Idiosyncratic risks are risks that are uncorrelated with other risks. For example, a building catching on fire, a hurricane, a CEO death, etc. We can hold a bunch of companies and these sorts of risks cancel each other out, on average.
Systematic risks are risks we can’t easily diversify, such as risk that the general economy goes into a depression. If people in the economy aren’t spending money, this affects all companies–we can’t hold a bunch of companies and eliminate this risk.
We have a post talking about idiosyncratic risk here. We also highlight how diversification eliminates idiosyncratic risk via the following graphic and accompanying spreadsheet, which I encourage you to investigate at your leisure.
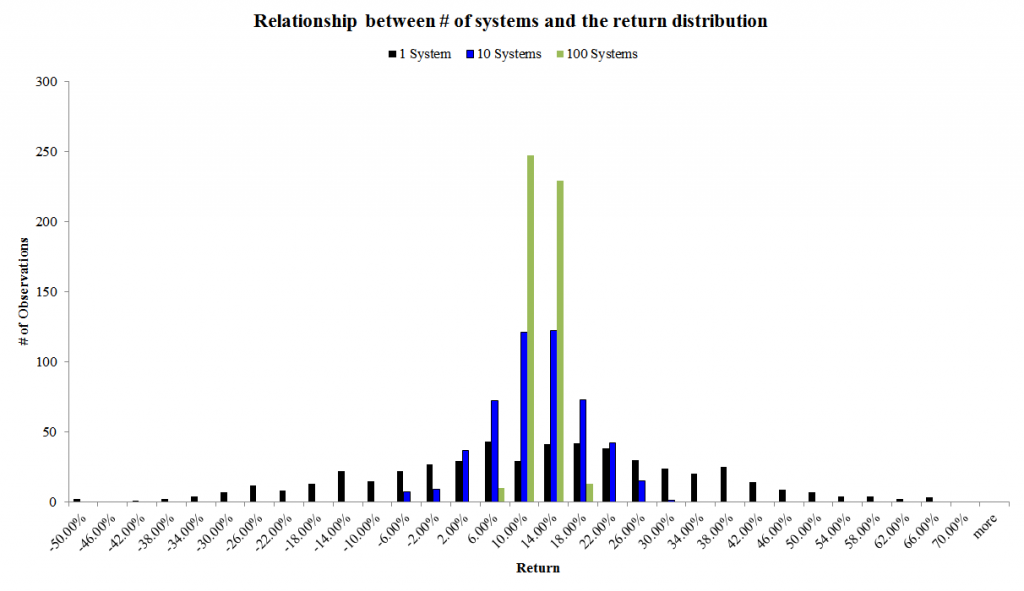
The results are hypothetical results and are NOT an indicator of future results and do NOT represent returns that any investor actually attained. Indexes are unmanaged, do not reflect management or trading fees, and one cannot invest directly in an index. Additional information regarding the construction of these results is available upon request.
The spreadsheet conducts 1000 simulations. In each simulation run, a system can either take 1 bet, 10 bets, or 100 bets–all uncorrelated. As the chart above suggests, one can manage risk by pooling truly uncorrelated bets together. As the number of bets increases, the volatility goes to zero and the expected value becomes the observation.
In the real world stocks don’t have zero correlation–correlations are much higher across equities. To get a better sense of how increasing portfolio size affects portfolio volatility we simply look to academia.
Elton and Gruber have multiple papers and books on the subject. Here is one paper in particular on the subject of portfolio size and portfolio risk:
Table 8 highlights the relationship between portfolio size and risk. Notice that the portfolio risk goes down as the portfolio size increases, however, risk never goes to zero and the benefits to holding a bigger portfolio decline rapidly after n=50.
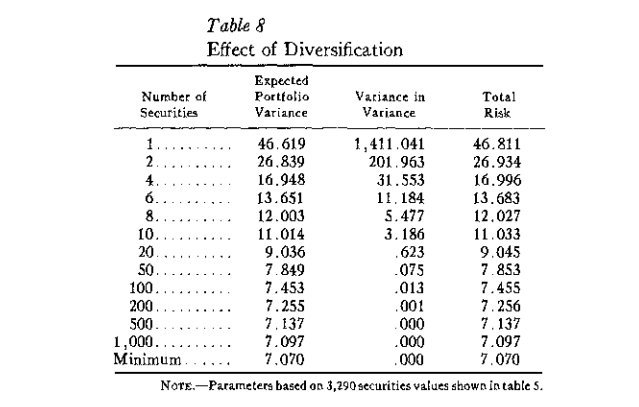
The results are hypothetical results and are NOT an indicator of future results and do NOT represent returns that any investor actually attained. Indexes are unmanaged, do not reflect management or trading fees, and one cannot invest directly in an index. Additional information regarding the construction of these results is available upon request.
The effect of portfolio size on portfolio volatility can be seen visually in the following chart:
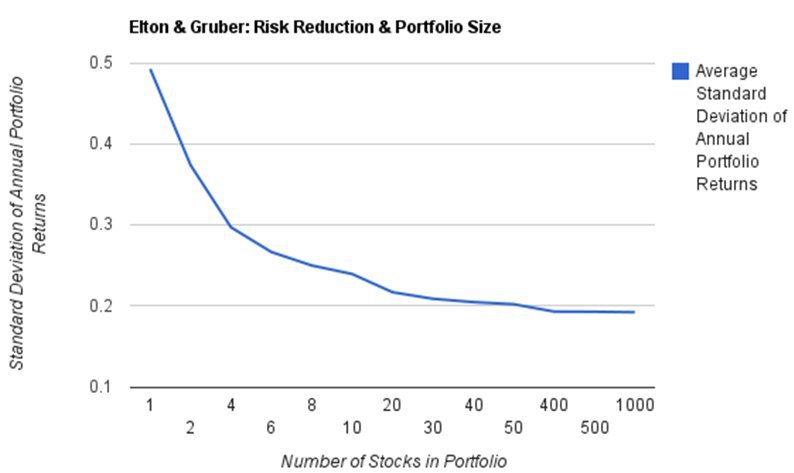
Source: Modern Portfolio Theory and Investment Analysis. The results are hypothetical results and are NOT an indicator of future results and do NOT represent returns that any investor actually attained. Indexes are unmanaged, do not reflect management or trading fees, and one cannot invest directly in an index. Additional information regarding the construction of these results is available upon request.
What’s the bottom line?
30-50 stocks seems to be a sweet-spot where an investor eliminates portfolio idiosyncratic volatility, as additional diversification beyond this point does not help reduce volatility in any dramatic way. However, by diversifying beyond 30-50 stocks, we also prevent our portfolio from concentrating on stocks we feel are “undervalued.” In other words, we probably want Warren Buffett to hold 30 or so stocks to ensure he doesn’t completely blow up, but we don’t want to force him to hold more than that, because it is unlikely he has more than 30 good ideas. In effect, he would be “diworsifying.”
How Does Diversification Affect Stock Selection Strategies?
We look at a simple high-performance value factor: EBIT/TEV (a version of enterprise multiple).
There is a clear historical relationship between the level of EBIT/TEV and future stock returns. Cheap stuff earns more than expensive stuff. We are not going to argue whether this extra return earned by cheap stocks is due to mispricing or fundamental risk, but let’s just agree it is an empirical fact in the historical data.
How does concentration affect returns to EBIT/TEV portfolios?
First, a quick description of the study we conduct from 1964-2013.
- Identify firms above NYSE 40th percentile for market capitalization that have information to calculate enterprise multiples.
- In today’s terms, this equates to a universe that looks at stocks with a market capitalization of ~$2B and up.
- Split firms into portfolios based on EBIT/TEV
- Top third (33%), which equates to around 279 names in the portfolio
- Top quintile (20%), which equates to around 167 names in the portfolio
- Top decile (10%), which equates to around 83 names in the portfolio
What do the results look like?
- EBIT Cheap Decile = Value-Weight, monthly re-balanced portfolio of cheapest 10% of EBIT/TEV stocks
- EBIT Cheap Quintile = Value-Weight, monthly re-balanced portfolio of cheapest 20% of EBIT/TEV stocks
- EBIT Cheap Tercile = Value-Weight, monthly re-balanced portfolio of cheapest 33% of EBIT/TEV stocks
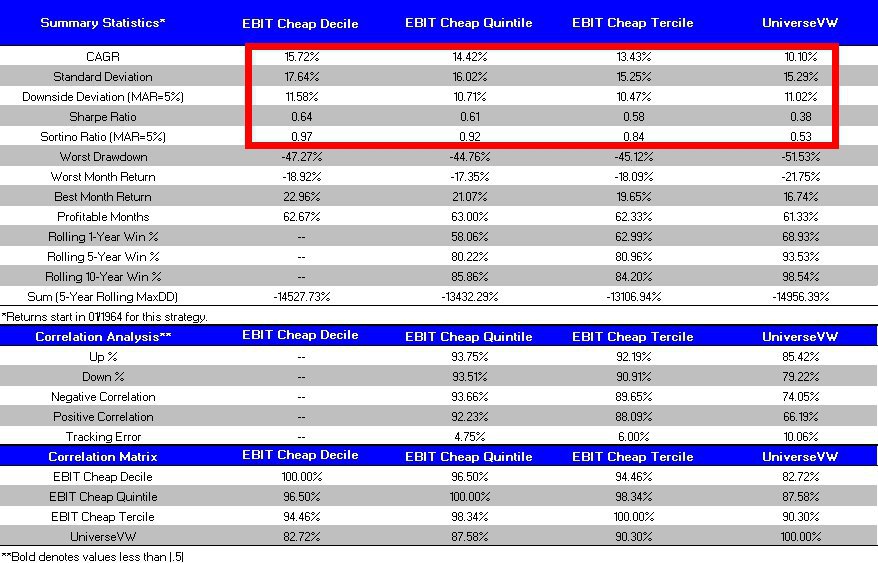
The results are hypothetical results and are NOT an indicator of future results and do NOT represent returns that any investor actually attained. Indexes are unmanaged, do not reflect management or trading fees, and one cannot invest directly in an index. Additional information regarding the construction of these results is available upon request.
More concentration increases compound annual growth rates, but also increases volatility (this makes sense because the larger portfolios are more diversified).
But what is the tradeoff between CAGR and volatility?
Based on Sharpe and Sortino ratios the evidence suggests that concentration is a better risk-adjusted bet. You get more bang for your buck by concentrating your holdings in systems that presumably earn higher risk-adjusted returns.
Here are the invested growth figures:
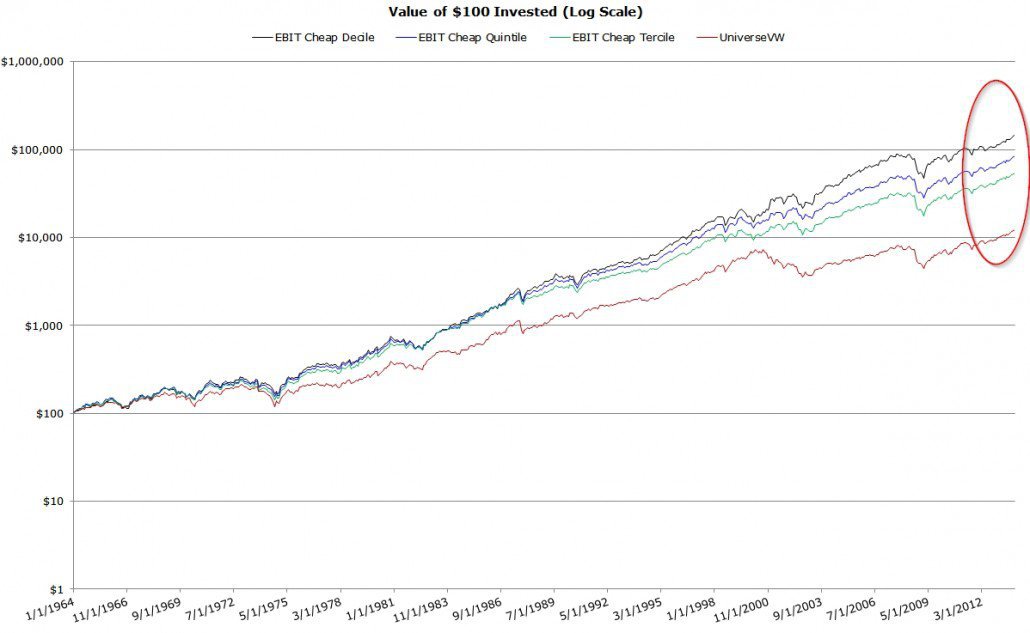
The results are hypothetical results and are NOT an indicator of future results and do NOT represent returns that any investor actually attained. Indexes are unmanaged, do not reflect management or trading fees, and one cannot invest directly in an index. Additional information regarding the construction of these results is available upon request.
What’s Do We Learn?
The simple exercise above highlights the cost benefit relationship between diversification and diworsifying, or diluting the alpha, of a proposed high performing strategy.
What are the implications for portfolio allocations?
Well, if you truly believe in a specific whiz-bang trading strategy, why would you invest in the strategy and allow the manager to hold 100, 200, or 300+ stocks? You would want your “active” manager to run a concentrated portfolio–otherwise you would be shooting them in the foot!
How does this concept play out in the marketplace?
Amazingly, there are very few true active managers. Most active approaches peddled by various investment managers are not active in any sense of the word–they have limited tracking error, hold large diversified portfolios, and don’t really bet on their presumed edge.
Examples:
Smart beta: You like value, so your approach is to hold a 500 stock portfolio that “tilts” towards value? As the analysis shows above, if you like value, BET ON VALUE. Otherwise, you are diworsifying.
Long-Bias Active Mutual funds and Hedge Funds with 100+ stock holdings: You are paying premium fees, and yet, you’re allowing the manager to diworsify their skill away and force them to act more like an index?
About the Author: Wesley Gray, PhD
—
Important Disclosures
For informational and educational purposes only and should not be construed as specific investment, accounting, legal, or tax advice. Certain information is deemed to be reliable, but its accuracy and completeness cannot be guaranteed. Third party information may become outdated or otherwise superseded without notice. Neither the Securities and Exchange Commission (SEC) nor any other federal or state agency has approved, determined the accuracy, or confirmed the adequacy of this article.
The views and opinions expressed herein are those of the author and do not necessarily reflect the views of Alpha Architect, its affiliates or its employees. Our full disclosures are available here. Definitions of common statistics used in our analysis are available here (towards the bottom).
Join thousands of other readers and subscribe to our blog.