A week ago, we posted an article that presented simulation performances of low-volatility strategies. The results illustrated that low-volatility portfolios do have higher returns and lower risks than high-volatility portfolios.
The point of this research piece is to identify if the low volatility anomaly is different than the value investing anomaly.
To test our hypothesis, we look at the performance of volatility-based strategies within Value and Growth stocks:
- Test the Low-Volatility Factor among Value Stocks;
- Test the Low-Volatility Factor among Growth Stocks;
Our Methodology
We construct low-vol and high-vol portfolios among Values and Growth stocks.
Similar to our previous simulation posts, low-vol portfolios are constructed based on Beta (we also look at IVOL, or idiosyncratic volatility, as a robustness test. The results are very similar).
Our value/growth portfolios are constructed based on EBIT/TEV rankings.
Here are the 2 value portfolios:
To test the Low-Volatility Factor Among Value Stocks:
- high EBIT Low BETA: low vol value stocks
- high EBIT high BETA: high vol value stocks
Here are the 2 growth portfolios:
To test Low-Volatility Factor Among Growth Stocks:
- low EBIT Low BETA: low vol growth stocks
- low EBIT high BETA: high vol growth stocks
Simulation Background
First, we break stocks into 5 valuation quintiles from 1963 to 2013 based on EBIT/TEV rankings.
- For example, if there are 10,000 stocks, stocks 1-2000 go in the first quintile (Value); stocks 8,001-10,000 go in the fifth qintile (Growth).
Next, we rank stocks on BETA (or IVOL) into 5 buckets (quintiles) within the EBIT/TEV deciles.
- For example, if we have 2,000 stocks in the top EBIT/TEV quintile, we’d break those 2,000 stocks into 5 buckets of 400 stocks based on BETA rankings.
Finally, we do 1,000 simulations of random 30 stocks portfolios drawn from either the “High EBIT Low BETA” portfolio or the “High EBIT High BETA” portfolio.
Again, image we have a monkey (named Mr. Random) throwing 30 darts, every month during the 50 year period, to establish in each month separate 30 stock portfolios. Once Mr. Random has thrown his 30 darts in each month, we will have 600 separate monthly portfolios (12 months*50 years) and will have made 18,000 (30 stocks*600 months) individual stock picks. This represents one simulation. We will do 1000 such simulations for the “High EBIT Low BETA” bucket and another 1000 simulations for the “High EBIT High BETA” bucket.
Each simulated strategy represents the returns a low vol value investor or a high vol value investor would achieve over the full time period.
We calculate compound annual growth rates (CAGR), standard deviation, and maximum drawdown, and compile the results in the charts below.
What Do the Value Returns Look Like?
Low vol value and high vol value stocks generate similar CAGRs, with a slight edge for low vol value. On the whole, the evidence suggests that low volatility value stocks are primarily driven by their value exposure, but there is a small edge to low vol stocks. (Click here to compare with beta factor effect among all stocks).
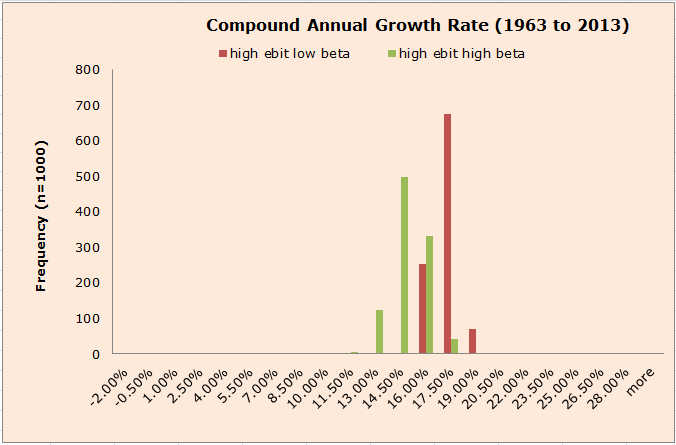
The results are hypothetical results and are NOT an indicator of future results and do NOT represent returns that any investor actually attained. Indexes are unmanaged, do not reflect management or trading fees, and one cannot invest directly in an index. Additional information regarding the construction of these results is available upon request.
How About the Risks?
The standard deviations of low vol value portfolios are much smaller than high vol value portfolios. On a risk-adjusted basis, low volatility does seem to add marginal value to a strict value strategy.
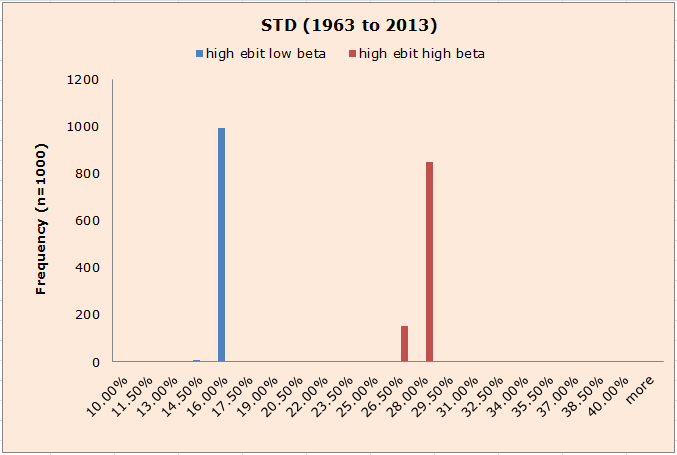
The results are hypothetical results and are NOT an indicator of future results and do NOT represent returns that any investor actually attained. Indexes are unmanaged, do not reflect management or trading fees, and one cannot invest directly in an index. Additional information regarding the construction of these results is available upon request.
As for maximum drawdowns, the evidence is in line with standard deviations: low vol value performs much better than high vol value.
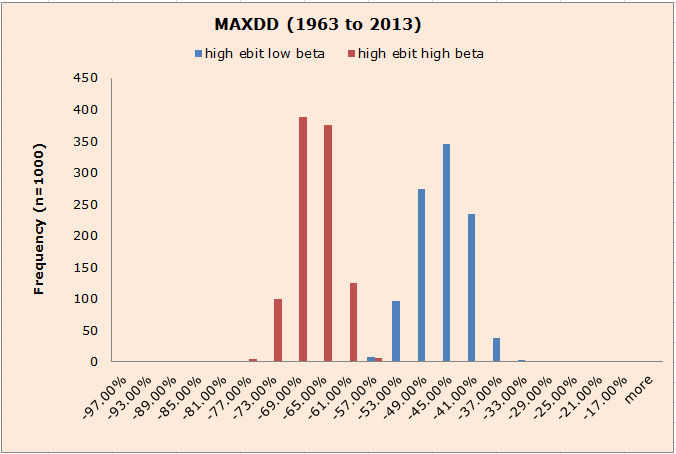
The results are hypothetical results and are NOT an indicator of future results and do NOT represent returns that any investor actually attained. Indexes are unmanaged, do not reflect management or trading fees, and one cannot invest directly in an index. Additional information regarding the construction of these results is available upon request.
What Do the Growth Returns Look Like?
We conduct a similar simulation process as the one outlined above. The only difference is that we test the beta factor among Growth stocks.
Similar to value stocks, among growth stocks, there isn’t a huge difference between low vol and high vol stocks, suggesting that price is the determining factor for returns, not volatility measures.
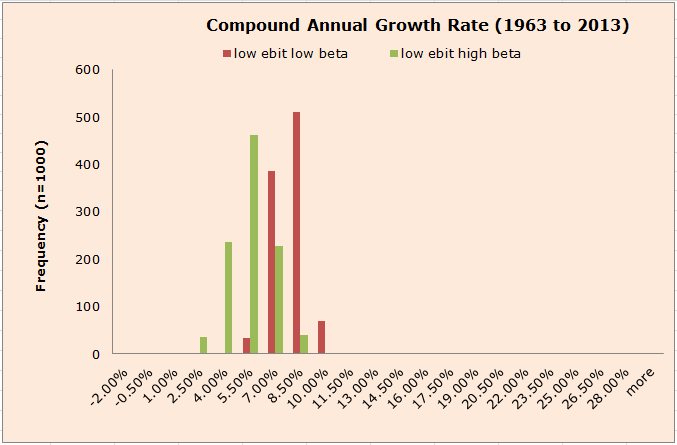
The results are hypothetical results and are NOT an indicator of future results and do NOT represent returns that any investor actually attained. Indexes are unmanaged, do not reflect management or trading fees, and one cannot invest directly in an index. Additional information regarding the construction of these results is available upon request.
Controlling for growth characteristics, low volatility growth definitely has lower risk than the high volatility growth portfolio.
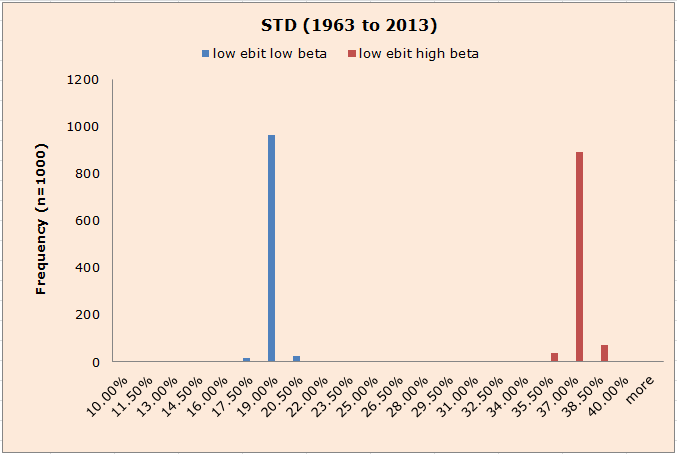
The results are hypothetical results and are NOT an indicator of future results and do NOT represent returns that any investor actually attained. Indexes are unmanaged, do not reflect management or trading fees, and one cannot invest directly in an index. Additional information regarding the construction of these results is available upon request.
Maximum drawdowns tell a similar story as the standard deviations–low vol growth beats high vol growth.
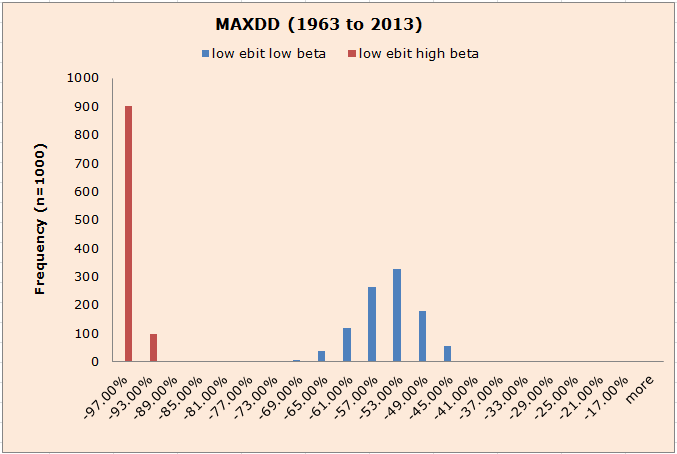
The results are hypothetical results and are NOT an indicator of future results and do NOT represent returns that any investor actually attained. Indexes are unmanaged, do not reflect management or trading fees, and one cannot invest directly in an index. Additional information regarding the construction of these results is available upon request.
Conclusions:
A large part of the performance associated with low volatility stocks is clearly being driven by exposures to value; however, there does appear to be some marginal benefit to investing in low volatility stocks. In the grand scheme of anomalies, I’d give value and momentum a gold medal, and low volatility would get a bronze–not bad!

About the Author: Wesley Gray, PhD
—
Important Disclosures
For informational and educational purposes only and should not be construed as specific investment, accounting, legal, or tax advice. Certain information is deemed to be reliable, but its accuracy and completeness cannot be guaranteed. Third party information may become outdated or otherwise superseded without notice. Neither the Securities and Exchange Commission (SEC) nor any other federal or state agency has approved, determined the accuracy, or confirmed the adequacy of this article.
The views and opinions expressed herein are those of the author and do not necessarily reflect the views of Alpha Architect, its affiliates or its employees. Our full disclosures are available here. Definitions of common statistics used in our analysis are available here (towards the bottom).
Join thousands of other readers and subscribe to our blog.