Institutional Investors and Stock Return Anomalies
- Edelen, Ince and Kadlec
- A version of the paper can be found here.
- Want a summary of academic papers with alpha? Check out our Academic Research Recap Category.
Abstract:
We examine institutional investor demand for stocks that are categorized as mispriced according to twelve well-known pricing anomalies. We find that institutional demand during the year prior to anomaly portfolio formation is typically on the wrong side of the anomalies’ implied mispricing. That is, we find increases in institutional ownership for overvalued stocks and decreases in institutional ownership for undervalued stocks. Moreover, abnormal returns for all twelve anomalies are concentrated almost entirely in stocks with institutional demand on the wrong side. We consider several competing explanations for these puzzling results.
Alpha Highlight:
Institutional investors are believed be more “sophisticated.” If any group of investors is exploiting “anomalies,” these investors should be at the top of the list.
But are institutional investors actually “smart?” In this paper, the author question this basic assumption.
The authors first introduce a finding from Lewellen (2011):
“The returns and stock holdings of institutional investors from 1980 to 2007 provide little evidence of stock-picking skill. Institutions as a whole closely mimic the market portfolio, with pre-cost returns that have nearly perfect correlation with the value-weighted index and an insignificant CAPM alpha of 0.08% quarterly.”
In line with Lewellen (2011), this paper find that institutional investors fail to take advantage of anomalies and generally trade on the wrong side of an anomaly: They buy “overvalued” stocks and sell “undervalued” stocks!
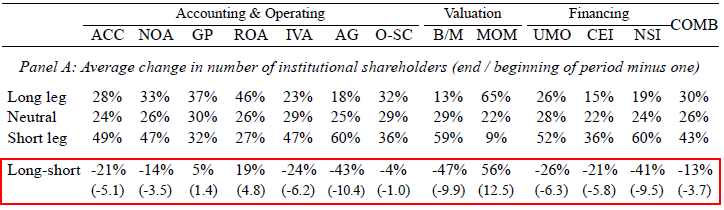
To address this question, the authors examine changes in institutional holdings in the year prior to the observation of anomalous returns (namely, pre-anomaly trading window). To be specific, they test whether the changes were on the “right side” or “wrong side” of the anomaly’s implied mispricing.
Some notes are listed below:
- “Right side” means long positions in ex-post top-performing stocks and short positions in low performing stocks.
- Anomaly portfolios are constructed by 12 different methodologies identified in previous literature. Detailed descriptions can be found in Table 1.
- Paper tests the change in number of institutions and the change in the fraction of shares held by institutions.
Key Findings:
Are institutional investors taking positions contrary to anomaly prescriptions?
Yes.
The net change in the number of institutional shareholders is significantly negative for 9 out of 12 anomalies during the pre-anomaly trading window, which indicates that institutional investors tend to buy “overvalued” stocks and sell “undervalued” stocks.
Does this contrary trading reflect institutions’ selective skills to intentionally capture contrarian anomalies?
No.
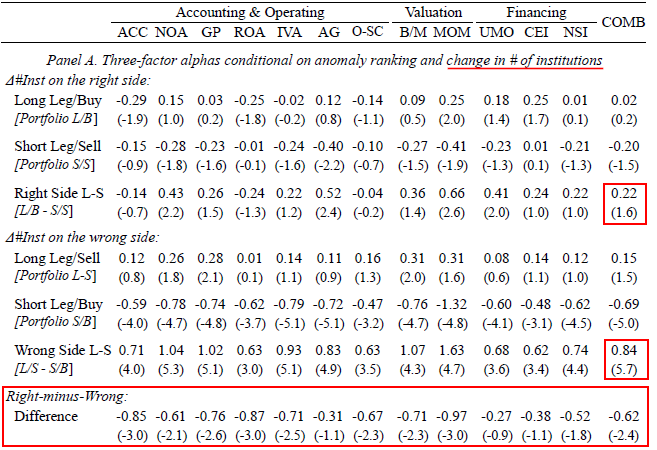
Across the 12 anomalies, the monthly three-factor alpha for L/S portfolios formed using stocks where the change in institutional investors is on the wrong side is 84 bps, versus 22bps for L/S portfolios formed using stocks where the change in institutional investors is on the right side.
Abnormal returns for all 12 anomalies are concentrated almost entirely in stocks where institutional demand is on the wrong side of the trade.
About the Author: Wesley Gray, PhD
—
Important Disclosures
For informational and educational purposes only and should not be construed as specific investment, accounting, legal, or tax advice. Certain information is deemed to be reliable, but its accuracy and completeness cannot be guaranteed. Third party information may become outdated or otherwise superseded without notice. Neither the Securities and Exchange Commission (SEC) nor any other federal or state agency has approved, determined the accuracy, or confirmed the adequacy of this article.
The views and opinions expressed herein are those of the author and do not necessarily reflect the views of Alpha Architect, its affiliates or its employees. Our full disclosures are available here. Definitions of common statistics used in our analysis are available here (towards the bottom).
Join thousands of other readers and subscribe to our blog.