Beware of any investment that has the word, “yield,” embedded in the title. This is especially important for “dividend yield” strategies.
Because the term makes investors salivate, marketing-focused asset managers leverage this knowledge to sell unsuspecting investors financial products. Probably the most nefarious activity comes in the form of “juicing” dividends, which we highlighted here in an old research summary post. The authors of this paper (Harris, Hartzmark, and Solomon), find the following:
“Some mutual funds purchase stocks before dividend payments to artificially increase their dividends, which we call “juicing”…Juicing is costly to investors.“
That said, not all strategies associated with “yield” are bad. In fact, Jack and I published a paper in the Journal of Investing on the subject of shareholder yield and savvy practitioners, for example, Meb Faber and Pat O’Shaughnessy, highlight the benefits of shareholder yield and use this signal in their investment approaches.(1)
Our bottomline from our research is as follows:
High dividend yield stocks do not reliably earn above-average risk-adjusted returns. More complete measures of shareholder yield, which account for net share repurchases, perform better.
While we focused a lot on the concept of shareholder yield in our paper, “Enhancing the Investment Performance of Yield-Based Strategies,” we probably should have put more emphasis on our finding that most yield-based strategies reflect noisy “value” investing strategies–and their close affiliation with value investing is why they have strong historical performance. In short, good high dividend yield stock investing is the same as good value investing: if the stocks are cheap (e.g., low P/E, or low P/B) — good — if the stocks are expensive — bad. Below is a chart from our paper that makes this more clear.

The results are hypothetical results and are NOT an indicator of future results and do NOT represent returns that any investor actually attained. Indexes are unmanaged, do not reflect management or trading fees, and one cannot invest directly in an index. Additional information regarding the construction of these results is available upon request.
Note that the 3 factor FF alpha, which accounts for market, size, and generic value exposure (i.e., B/M), has no discernible alpha over time and across various samples. In other words, high dividend yield investing is not that unique.
Dividend Stock Valuations
In this piece we update a post we did 2 years prior (3/24/2015), which highlighted that high dividend yield stocks were expensive and lower quality than the overall market. Not exactly exciting for dividend yield investors looking to benefit from the expected value premium.
Since that time, there really hasn’t been a discernible total return performance difference between high dividend yield stocks and the general market:

Source: Factset
Today, high dividend yield stocks aren’t expensive like they were 2 years ago, and are arguably getting into the “cheap” category.
Why Can High Dividend-Yield Stocks Sometimes Get Expensive?
Consider the typical day in the marketplace:
Investors screaming…
I want dividend yield!!!
…and asset managers launching product to fulfill demand:
“________ Dividend Yield Fund just launched!
The demand for dividends are so high, there is even research suggesting that the demand may warp asset prices. For example, see our piece here on, “The Dividend Month Premium,” by Hartzmark and Solomon.
Visualizing Valuation Among High Dividend Yield Stocks
We first look at 2 measures of cheapness: Earnings before interest and taxes to total enterprise value (EBIT/TEV) and price-to-earnings (P/E).(2)
EBIT/TEV and Dividend Yield
First, we look at valuations based on EBIT/TEV (higher is cheaper; lower is more expensive). The green line is the S&P 500 median EBIT/TEV; the red line is the median EBIT/TEV for the top 50 yield names (happens to be ~same as the S&P 500 at the moment); and the bars highlight the distribution of EBIT/TEV for the high yield portfolio.
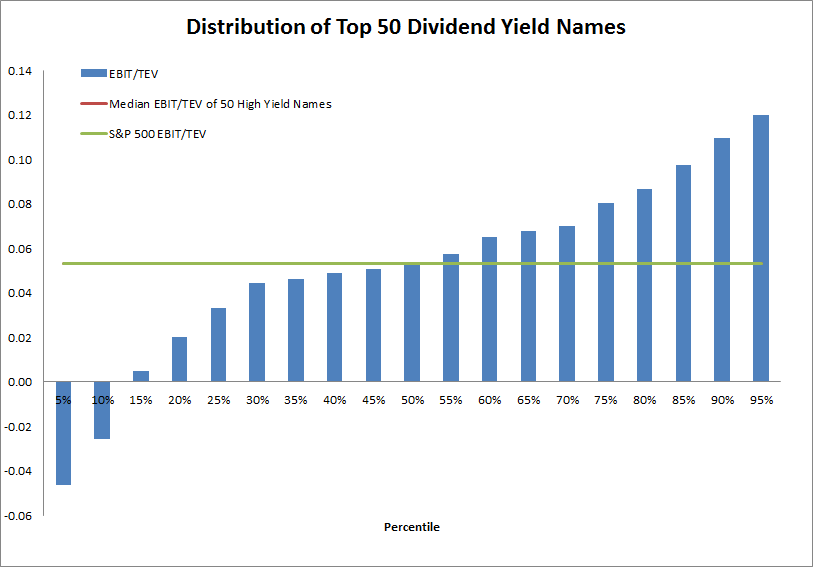
The results are hypothetical results and are NOT an indicator of future results and do NOT represent returns that any investor actually attained. Indexes are unmanaged, do not reflect management or trading fees, and one cannot invest directly in an index. Additional information regarding the construction of these results is available upon request. As of 3/17/2017.
High dividend yield stocks are no longer more expensive than the market (green line = red line), like they were in 2015 (green line > red line). There are certainly some cheap high-yield stocks, but on average, the bucket of 50 names is equivalently valued based on EBIT/TEV.
Here are the results from 2 years prior:
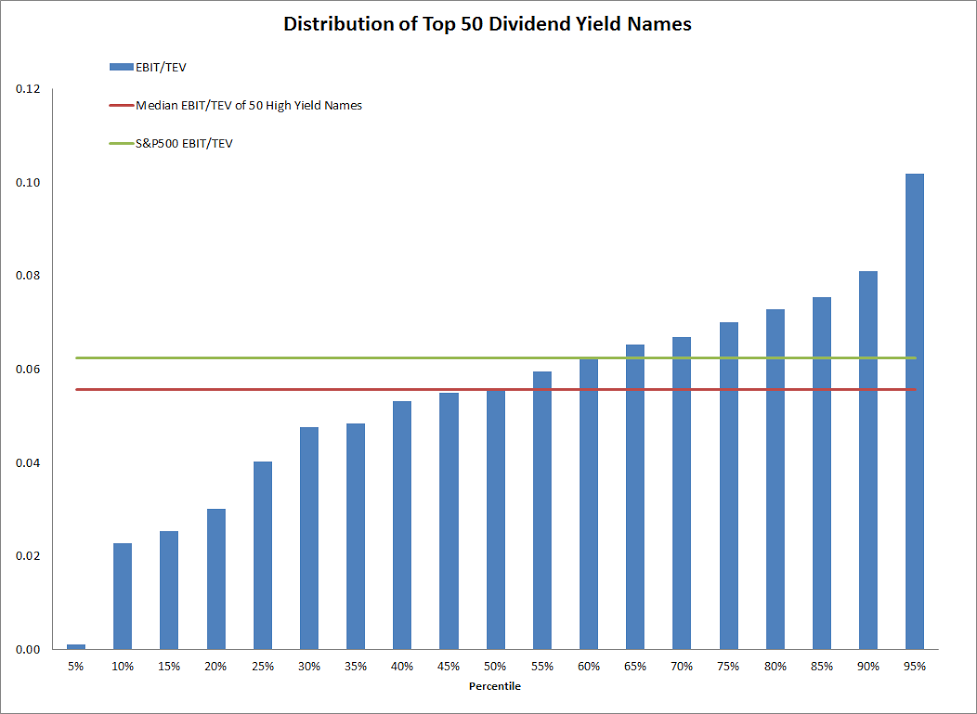
The results are hypothetical results and are NOT an indicator of future results and do NOT represent returns that any investor actually attained. Indexes are unmanaged, do not reflect management or trading fees, and one cannot invest directly in an index. Additional information regarding the construction of these results is available upon request. As of 3/24/2015.
P/E and Dividend Yield
Valuations based on P/E(3) suggests a different story: high dividend yield stocks are now less expensive than the market (red line < green line).
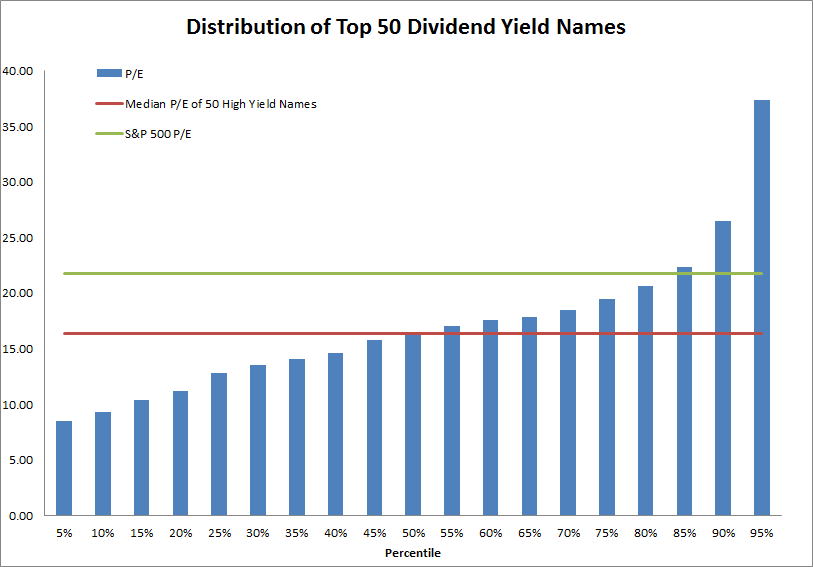
The results are hypothetical results and are NOT an indicator of future results and do NOT represent returns that any investor actually attained. Indexes are unmanaged, do not reflect management or trading fees, and one cannot invest directly in an index. Additional information regarding the construction of these results is available upon request. As of 3/17/2017.
Here are the results from 2 years prior when dividend yield stocks were more expensive:
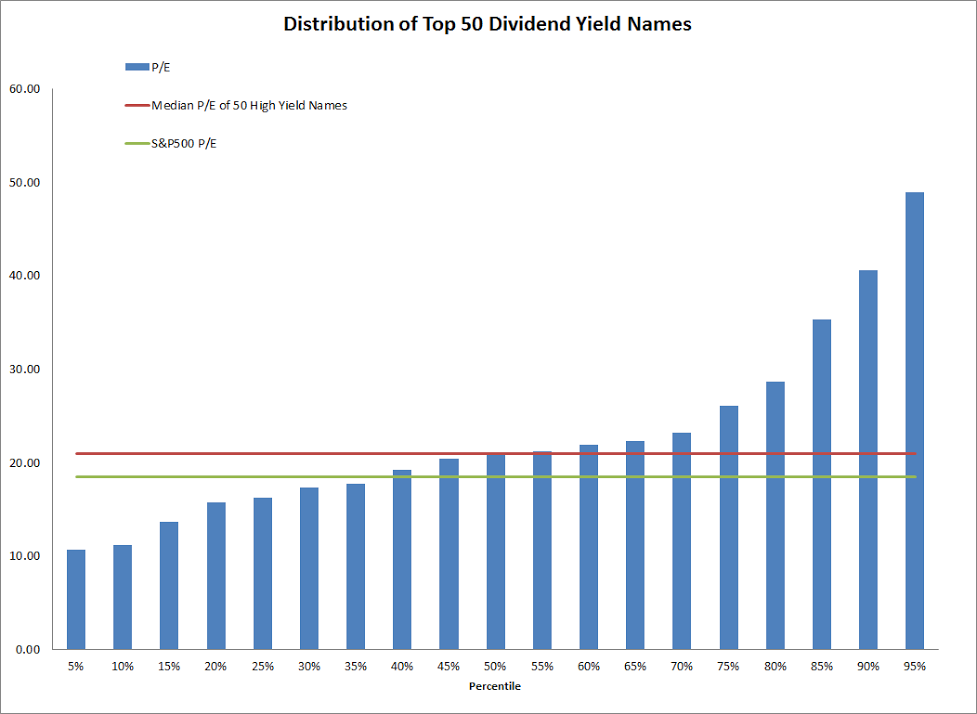
The results are hypothetical results and are NOT an indicator of future results and do NOT represent returns that any investor actually attained. Indexes are unmanaged, do not reflect management or trading fees, and one cannot invest directly in an index. Additional information regarding the construction of these results is available upon request. As of 3/24/2015.
In summary, the top 50 high dividend yield names are cheap relative to the market on P/E metrics and similarly priced based on EBIT/TEV. Despite more favorable relative valuations compared to 3/24/2015, dividend yield stock valuations are now more interesting if one is looking to capture the value premium via their high dividend yield stock exposure.
Perhaps High-Dividend Yield Companies are Lower Quality and Justify a Discount?
A knee-jerk reaction to the results above might be along the lines of the following:
Well, yeah, they are cheaper, but these high yield companies are low quality companies so they deserve a discount.
The evidence seems to support this notion: high dividend yield companies are currently lower ROE and ROA than the broader market.
Return on Equity
First, a look at return on equity. High dividend yield stocks actually have higher ROE than the typical S&P 500 firm.
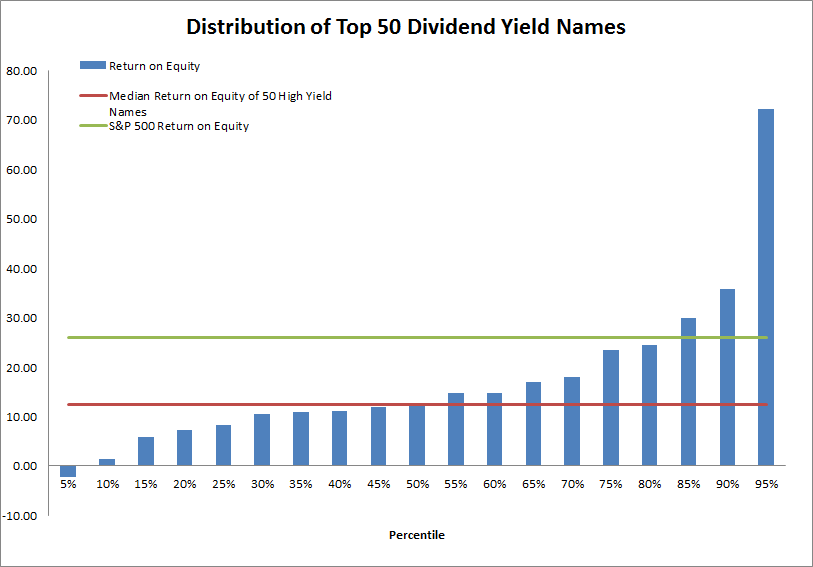
The results are hypothetical results and are NOT an indicator of future results and do NOT represent returns that any investor actually attained. Indexes are unmanaged, do not reflect management or trading fees, and one cannot invest directly in an index. Additional information regarding the construction of these results is available upon request. As of 3/17/2017.
Note the large spread between the broad market index ROE and the top 50 high dividend yielding names.
Return on Assets
Now we look at return on assets. A similar, but muted finding: High dividend yield stocks have much lower ROA than the S&P 500.
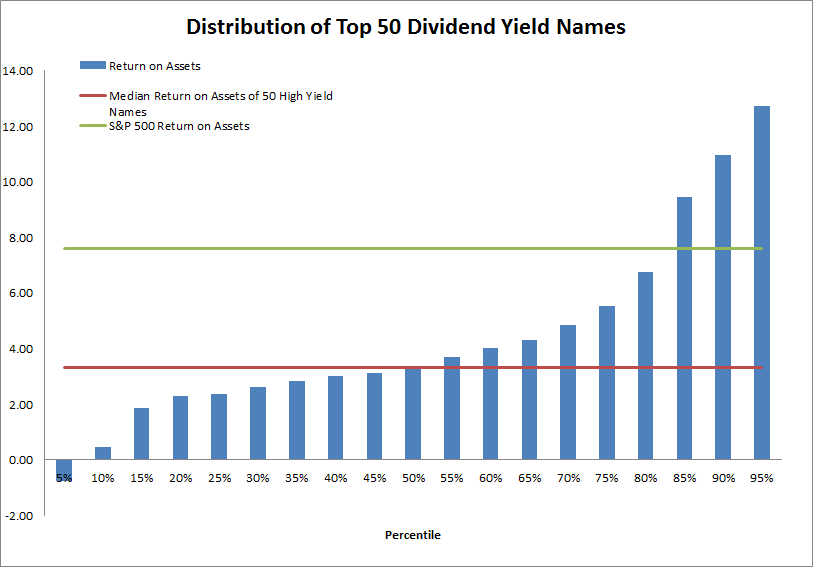
The results are hypothetical results and are NOT an indicator of future results and do NOT represent returns that any investor actually attained. Indexes are unmanaged, do not reflect management or trading fees, and one cannot invest directly in an index. Additional information regarding the construction of these results is available upon request. As of 3/17/2017.
In summary, high dividend yield stocks are generally of lower quality than the market (at least based on TTM ROE and ROA).
Excited to Buy Relatively Cheap, Lower Quality High Dividend Yield Stocks?
Based on the analysis from 2 years ago, if you were venturing into high dividend yield funds your odds were somewhat bleak because you were buying relatively expensive and low-quality stocks. And as Ben Graham discussed in the past, intelligent investing is about buying stocks with a margin of safety. High dividend yield stocks didn’t pass muster.
But the situation has changed a bit: The top 50 dividend payers, as a group, are relatively cheaper than the market. The problem is you might be getting what you paid for because high dividend yielders are also lower quality.
If one believes in buying the cheapest, highest quality value stocks, high yielders aren’t for you. But if you are dead set on high dividend yielding firms, now is arguably a better time to buy than it was 2 years prior.
Good luck!
References[+]
| ↑1 | Also, don’t forget that dividends are taxable. To the extent that your total return consists of a larger amount deriving from taxable yields you are losing tax deferral benefits. See a great post Meb has on this subject, which is backed by research we conducted. |
|---|---|
| ↑2 | P/E is straight forward, and for those unfamiliar with EBIT/TEV, this measure generates the largest value premium. |
| ↑3 | higher is more expensive; lower is cheaper, which is opposite of EBIT/TEV, where higher is cheaper and lower is more expensive |
About the Author: Wesley Gray, PhD
—
Important Disclosures
For informational and educational purposes only and should not be construed as specific investment, accounting, legal, or tax advice. Certain information is deemed to be reliable, but its accuracy and completeness cannot be guaranteed. Third party information may become outdated or otherwise superseded without notice. Neither the Securities and Exchange Commission (SEC) nor any other federal or state agency has approved, determined the accuracy, or confirmed the adequacy of this article.
The views and opinions expressed herein are those of the author and do not necessarily reflect the views of Alpha Architect, its affiliates or its employees. Our full disclosures are available here. Definitions of common statistics used in our analysis are available here (towards the bottom).
Join thousands of other readers and subscribe to our blog.