Multifactor Explanations of Asset Pricing Anomalies
- Fama and French (1996)
- A version of the paper can be found here.
- Want a summary of academic papers with alpha? Check out our Academic Research Recap Category.
Abstract:
Previous work shows that average returns on common stocks are related to firm characteristics like size, earnings/price, cash flow/price, book-to-market equity, past sales growth, long-term past return, and short-term past return. Because these patterns in average returns apparently are not explained by the CAPM, they are called anomalies. We find that, except for the continuation of short-term returns, the anomalies largely disappear in a three-factor model. Our results are consistent with rational ICAPM or APT asset pricing, but we also consider irrational pricing and data problems as possible explanations.
Core Idea:
In 1993, Fama and French argued that value stocks with high B/M ratios have higher premiums, and such premiums cannot be explained by the traditional CAPM model. Fama and French defined a three-factor model to help better explain the cross-section of stock returns, or why some stocks earn higher returns than others.
However, asset pricing researchers continued to flood the academic journals with new anomalies that challenged the Fama and French 3-factor model. For example, as we have discussed recently on the blog, DeBondt and Thaler (1985) find a reversal in long-term returns and Jegadeesh and Titman (1993) find intermediate-term momentum.
In this paper, Fama and French (1996) defend their 3-factor model by showing that many anomalies from previous literature disappear in the context of their 3-factor model.
The anomalies that lack robustness are as follows:
- Earnings/Price, Cash Flow/Price, and past sales growth:
Table III in the paper shows that the 3-factor model can capture the returns to portfolios formed on E/P, C/P, and sales growth. Specifically, low E/P, low C/P, and high sales growth are typical of strong firms that have negative slopes on HML, and they have lower expected returns. Conversely, high E/P, high C/P, and low sales growth are typical of weak firms that have positive slopes on HML, and they have higher expected returns. As HML returns are positive, loading positively on this factor, which E/P, C/P and sales growth do, leads to higher expected returns. The 3-factor model would seem to explain these anomalies, which Fama and French argue simply load on HML.
- Long-term past return anomalies
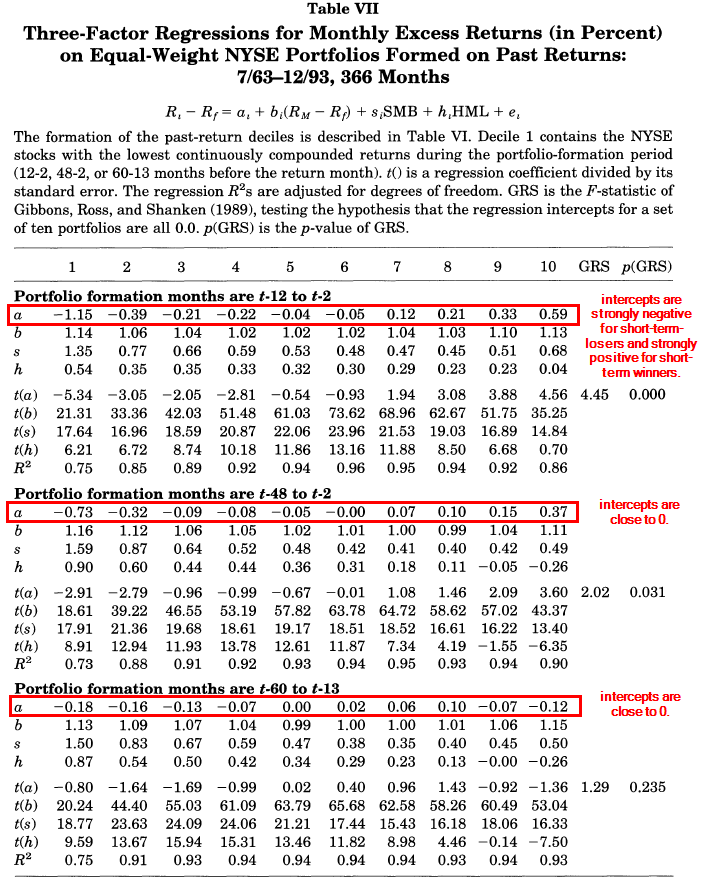
Panel B and C of Table VII below shows that 3-factor model can also capture the reversal of long-term returns documented by DeBondt and Thaler (1985).
DeBondt and Thaler noted that extreme price movements over long formation periods were followed by movements in the opposite direction. (If you are curious about the details, we wrote a post about this)
Once again, Fama and French say the 3-factor model can account for this. In another word, long-term losers tend to have positive HML slopes and higher future average returns. Conversely, long-term winners tend to be strong stocks that have negative slopes on HML and low future returns. Panel C demonstrates this especially clearly. Again, Fama and French argue that DeBondt and Thaler are just loading on the HML factor.
But what happens if we examine shorter formation periods for momentum?
“Main Embarrassment” of the 3-factor Model
Here Fama and French run into problems. Fama and French (1996) admit that the “main embarrassment” of the three-factor model is its failure to capture the continuation of short-term momentum anomalies.
The first panel in Table VII below shows that in the three-factor regressions, the intercepts are strongly negative for short-term-losers and strongly positive for short-term winners. So there is something going on here that is not explained by the 3-factor model.
The problem is that losers load more on SMB and HML than winners. Thus, as for the portfolios formed on long-term past returns, the three-factor model predicts reversal for the post-formation returns of short-term losers and winners, and so missed the observed continuation. — FF(1996)
While many anomalies disappear under robust tests, shorter term momentum anomalies (formation periods ~1 year) are robust. These could not be explained by existing risk factors. This is a significant admission from Fama French:
We have saved until last the discussion of the main embarassment of the three-factor model, its failure to capture the continuation of short-term returns documented by Jegadeesh and Titman (1993) and Asness (1994). There are at least three possible stories.
- “Spurious result of data snooping.”
- “Asset pricing is irrational.”
- “Asset pricing is rational, but our three-factor model is (alas!) just a model, and the continuation anomaly exposes one of its shortcomings.”
Carhart 4-factor Model: MOM Factor Formally Added
Carhart (1997) constructs his 4-factor model by using FF 3-factor model plus an additional momentum factor. He shows that his 4-factor model with MOM substantially improves the average pricing errors of the CAPM and the 3-factor model.
After his work, the standard factors of asset pricing model are now commonly recognized as Value, Size and Momentum.
About the Author: Jack Vogel, PhD
—
Important Disclosures
For informational and educational purposes only and should not be construed as specific investment, accounting, legal, or tax advice. Certain information is deemed to be reliable, but its accuracy and completeness cannot be guaranteed. Third party information may become outdated or otherwise superseded without notice. Neither the Securities and Exchange Commission (SEC) nor any other federal or state agency has approved, determined the accuracy, or confirmed the adequacy of this article.
The views and opinions expressed herein are those of the author and do not necessarily reflect the views of Alpha Architect, its affiliates or its employees. Our full disclosures are available here. Definitions of common statistics used in our analysis are available here (towards the bottom).
Join thousands of other readers and subscribe to our blog.