Good Carry, Bad Carry
- Bekaert and Panayotov
- A version of the paper can be found here.
- Want a summary of academic papers with alpha? Check out our Academic Research Recap Category.
Abstract:
We distinguish between “good” and “bad” carry trades constructed from G-10 currencies. The good trades exhibit higher Sharpe ratios and slightly negative or even positive skewness, in contrast to the bad trades that have both substantially lower Sharpe ratios and skewness. Surprisingly, good carry trades do not involve the most typical carry trade currencies like the Australian dollar and Japanese yen. The distinction between good and bad trades significantly alters our understanding of currency carry trade returns. It invalidates, for example, explanations invoking return skewness and crash risk, as the negative return skewness is induced by the typical carry currencies. We find strong predictability with previously identified carry return predictors for bad, but not good carry trade returns. In addition, a static carry component explains a much larger proportion of bad carry trade returns, than of good carry trade returns. Furthermore, good carry trade returns perform better than bad carry trade returns as a risk factor, explaining the returns of interest-rate sorted currency portfolios, and in turn are better explained with equity market risk factors.
Alpha Highlight:
Within currency investing, the carry trade is based on the interest rate differentials across currencies. To be specific, an investor sells low-yielding currencies (such as the Japanese Yen), while simultaneously going long in high-yielding currencies (such as the Australia dollar). Pretty straight forward.
This paper comes up with an enhanced carry trading rule that helps distinguish “good” and “bad” currency subsets and then uses the “good” subsets to construct better carry trades. It takes G-10 currencies as the sample:
- New Zealand (NZD)
- Australian Dollar (AUD)
- British pound (GBP)
- Norwegian krone (NOK)
- Swedish krona (SEK)
- Canadian dollar (CAD)
- US dollar (USD)
- Euro (EUR)
- Swiss franc (CHF)
- Japanese yen (JPY)
Here are the trading rules:
Benchmark Carry Trading: symmetric carry trades that uses all G-10 currencies.
- Step 1: Rank G-10 currencies according to their forward differentials relative to the U.S. dollar (FDt=Ft/St-1) at the end of each month.
- Step 2: Over the following month, long the five currencies with the highest forward rate differentials (at forward discounts), and sell the five currencies with the lowest forward rate differentials (at forward premiums).
Enhanced Carry Trading: dynamically reduce the set of tradable currencies to improve the Sharpe ratio.
- Step 1: For the same period of benchmark trading, calculate the Sharpe ratio (SR) for each of the 10 possible trades that involve only 9 currencies. If the highest of these SRs exceeds the benchmark SR, then the currency omitted to achieve this highest SR is excluded for this date. If all of these SR’s are lower than the benchmark SR, no currency is excluded. In the end, this step tends to exclude AUD, NOK and JPY.
- Step 2: Construct the long-short equally-weighted carry trades, by sorting forward differentials. If the number of currencies in a subset is odd, the one with median forward differential is discarded.
- Step 3: The paper excludes up to 7 currencies.
Key Findings:
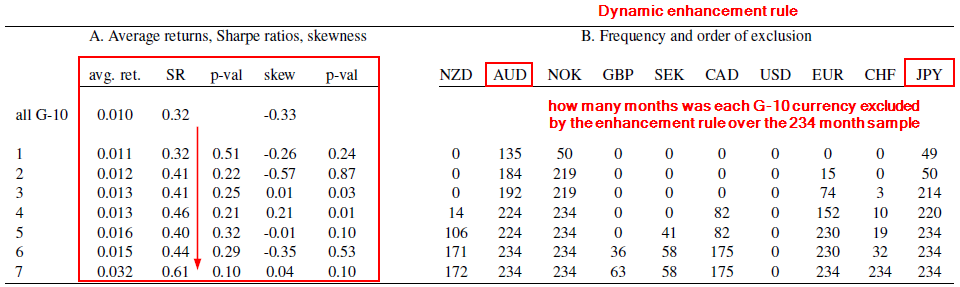
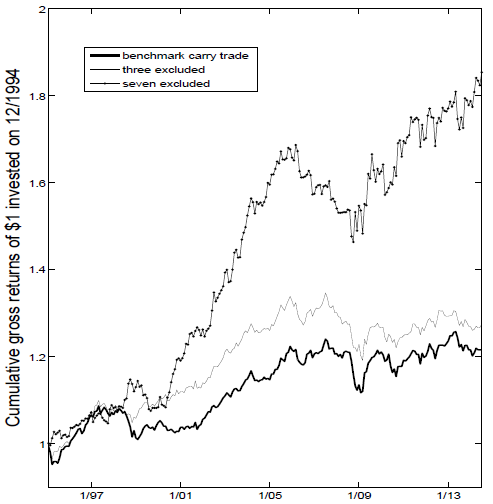
The test period is from 12/1984 to 06/2014. The table below shows the results of the seven enhanced trades vs. the benchmark (carry trade of all G-10). Panel A shows that the benchmark trade has an annualized Sharpe ratio of 0.32, and return skewness of -0.33. When only one currency is excluded, the performance basically doesn’t change. When two currencies are excluded, the Sharpe ratio increased, but not the skewness. The biggest benefit occurs when three or more currencies are excluded. Note, that when seven currencies are excluded, the performance is the best with a Sharpe ratio of 0.61 and a positive skewness (both table and graph).
The results are hypothetical results and are NOT an indicator of future results and do NOT represent returns that any investor actually attained. Indexes are unmanaged, do not reflect management or trading fees, and one cannot invest directly in an index. Additional information regarding the construction of these results is available upon request.
The results are hypothetical results and are NOT an indicator of future results and do NOT represent returns that any investor actually attained. Indexes are unmanaged, do not reflect management or trading fees, and one cannot invest directly in an index. Additional information regarding the construction of these results is available upon request.
Panel B shows how many months each G-10 currency was excluded by the enhancement rule over the total 234 month sample. Some of them (e.g. AUD, JPY, NOK) are excluded over and over, while others (e.g. GBP, SEK, and USD) are rarely excluded.
“Good” Carry and “Bad” Carry
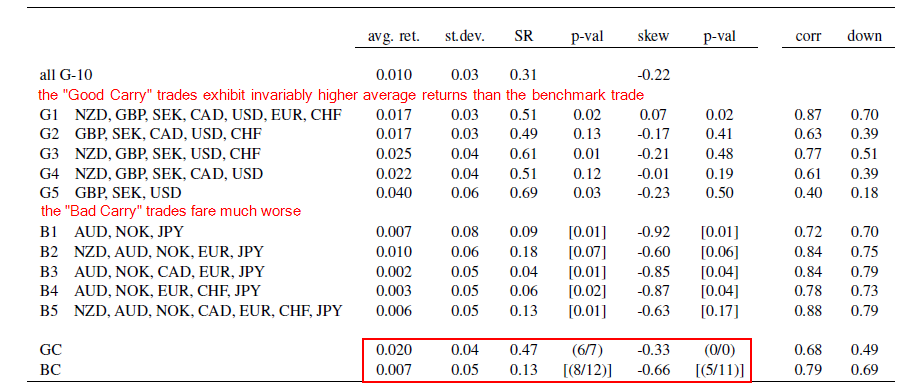
Five carry trades from fixed subsets are constructed (see table below): G1 exclued the AUD, NOK, and JPY; G2-G4 include the GBP, SEK and USD, together with any of the three possible pairs from the CAD, NZD and CHF; G5 keeps only GBP, SEK and USD. The paper labels G1-G5 as “Good” Carry.
In contrast, the paper constructs 5 “Bad” Carry trades that are exactly opposite to “Good” Carry. The results show that “Good” Carry trades show high Sharpe ratios, slightly negative or positive skewness, while “Bad” Carry trades show much worse performances.
The results are hypothetical results and are NOT an indicator of future results and do NOT represent returns that any investor actually attained. Indexes are unmanaged, do not reflect management or trading fees, and one cannot invest directly in an index. Additional information regarding the construction of these results is available upon request.
Conclusions
I’m not sure what to make of this paper. To start, the process of “enhancing” the currency trade is a bit complicated and not an “easy read.” But the punchline is that applying the carry-trade on different sub-samples of the G-10 currencies can have large effects on results. This is a bit scary from a robustness standpoint.
In general, there are some great insights and discussions related to FX–I learned a lot. However, on the other hand, I can’t help thinking that there is an element of hindsight bias embedded in the approach. The sub-sample analysis is at least partially driven by the data we’ve seen on the carry traded ex-post–would we have came to the same sub-samples if we were standing in 1984? I ‘m not sure.
So while this paper is interesting, we have to take the results with a grain of salt and defer to those who are experts in the field of FX trading.
About the Author: Wesley Gray, PhD
—
Important Disclosures
For informational and educational purposes only and should not be construed as specific investment, accounting, legal, or tax advice. Certain information is deemed to be reliable, but its accuracy and completeness cannot be guaranteed. Third party information may become outdated or otherwise superseded without notice. Neither the Securities and Exchange Commission (SEC) nor any other federal or state agency has approved, determined the accuracy, or confirmed the adequacy of this article.
The views and opinions expressed herein are those of the author and do not necessarily reflect the views of Alpha Architect, its affiliates or its employees. Our full disclosures are available here. Definitions of common statistics used in our analysis are available here (towards the bottom).
Join thousands of other readers and subscribe to our blog.