Barron’s recently ran an article (written by Research Affiliates), which is titled “Get Smart About Picking Dividend-Rich Stocks.” The article highlights that high-quality high-dividend-paying stocks outperform low-quality high-dividend-paying stocks. The quality of the firm is measured by profitability, financial distress, and accounting red flags.
We investigate a Simpler Way to Identify Top-Performing Dividend Stocks
We sort the high dividend-paying firms by a simple value investing measure–EBIT/TEV. We choose this value investing measure based on our own research discussed here.
First, let’s set up the experiment.
We examine all firms above the NYSE 40th percentile for market-cap (currently around $1.8 billion) to avoid weird empirical effects associated with micro/small cap stocks. We form the portfolios at a annual frequency with the following 2 variables:
- Dividend Yield = Cash dividends / market capitalization. Assessed on 6/30 each year.
- Value = EBIT/(Total Enterprise Value). Assessed on 6/30 each year.
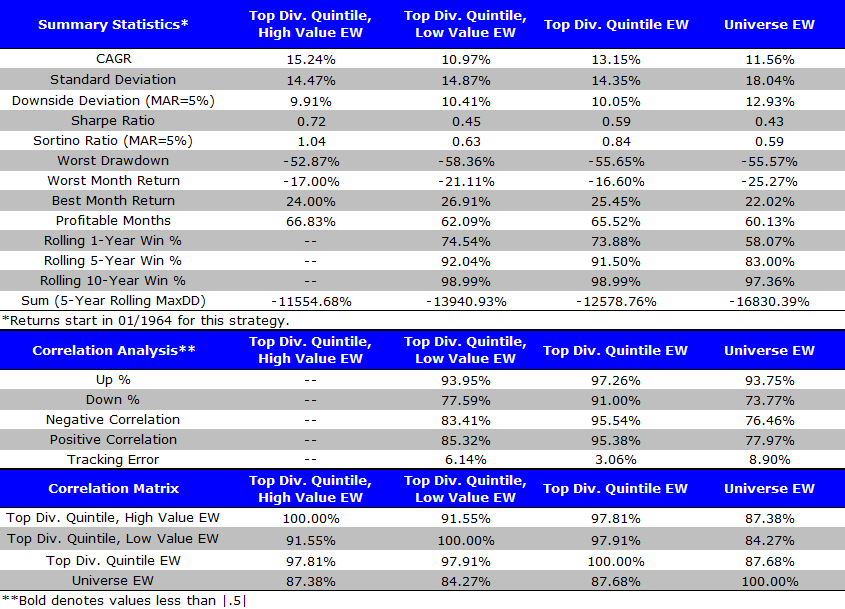
Here we describe the four portfolios we examine. All portfolios are annually rebalanced on 6/30 each year.
- Top Div. Quintile, High Value EW = Top quintile of firms on dividend yield, then choosing the top half on Value. Portfolio is equal-weighted.
- Top Div. Quintile, Low Value EW = Top quintile of firms on dividend yield, then choosing the bottom half on Value. Portfolio is equal-weighted.
- Top Div. Quintile EW = Top quintile of firms on dividend yield. Portfolio is equal-weighted.
- Universe EW = Total return on the universe of securities. Portfolio is equal-weighted.
Results are gross of management fees and transaction costs. All returns are total returns and include the reinvestment of distributions (e.g., dividends).
Here are the returns (1/1/1964-12/31/2014):
Value Investing Portfolio Results:
The results are hypothetical results and are NOT an indicator of future results and do NOT represent returns that any investor actually attained. Indexes are unmanaged, do not reflect management or trading fees, and one cannot invest directly in an index. Additional information regarding the construction of these results is available upon request.
Takeaways:
- The top quintile of dividend paying firms outperformed the universe over the past 50 years when comparing CAGR, Sharpe and Sortino ratios (comparing column 3 to column 4)
- Splitting high dividend-paying firms by value worked historically. Column 1 (top dividend payers, high value) outperformed column 2 (top dividend payers, low value) across all performance measures — CAGR, Sharpe and Sortino ratios.
Summary
The results suggest that a sort on a simple value investing measure works well at sorting dividend stocks. Compared to the more complex quality screen proposed by Barron’s, this sorting variable is a good alternative for investors who prefer high dividend stocks.
About the Author: Jack Vogel, PhD
—
Important Disclosures
For informational and educational purposes only and should not be construed as specific investment, accounting, legal, or tax advice. Certain information is deemed to be reliable, but its accuracy and completeness cannot be guaranteed. Third party information may become outdated or otherwise superseded without notice. Neither the Securities and Exchange Commission (SEC) nor any other federal or state agency has approved, determined the accuracy, or confirmed the adequacy of this article.
The views and opinions expressed herein are those of the author and do not necessarily reflect the views of Alpha Architect, its affiliates or its employees. Our full disclosures are available here. Definitions of common statistics used in our analysis are available here (towards the bottom).
Join thousands of other readers and subscribe to our blog.