Of the major asset classes, private equity has recently had the best absolute returns. According to Cambridge Associates, the 25-year return on private equity was 13.5%, relative to 9.75% for the Russell 2000. Academic studies, surveyed recently by Steven Kaplan and Berk Sensoy, have consistently found that private equity outperforms the public markets by 3-4% per year.
Based on historical performance, private equity is an interesting asset class, however, we must consider some of the major drawbacks:
- High fees
- High complexity
- Poor liquidity
- Poor transparency
Ouch.
Private equity scores pretty poorly on a lot of metrics that are important to investors. Ideally, one could replicate the success of the Barbarians at the Gates, but without the major drawbacks. But how?
We think we have found an answer.
Understanding Private Equity
The biggest difference between private equity and the typical public equity portfolio is that private equity firms are more aggressive in their use of debt. In 2014, the typical private equity investment had $49M in equity ($252B total / 1995 deals = $126mm EV * 39% =$49.3mm), transacted at ~9.7x EBITDA, and was financed with 61% net debt to enterprise value (5.9x EBITDA from WSJ).
What happens when we look at a portfolio of publicly-traded stocks with similar characteristics?
In a new paper, “Leveraged Small Value Equities,” by Brian Chingono and Dan Rasmussen, the authors study the performance of public companies that had comparable levels of leverage (as measured by net debt to enterprise value) to private equity investments. Brian and Dan find that small-cap value companies that have high levels of debt perform similar to LBO deals. A strategy that invests in portfolios of these companies can produce returns comparable to the gross returns of private equity (and best private equity on a net-basis). Unlike leveraged ETFs and other similar products, this strategy does not use margin lending or options to obtain leverage, but rather, invests in public companies that have high levels of debt on their balance sheets.
How the Authors Replicate Private Equity
This private equity replication method uses a multi-factor ranking system to find companies in the public markets that are similar to private equity deals on five key quantitative metrics: size, leverage, value, and capital allocation strategies (debt reduction and asset turnover).
The table below summarizes the returns of the top quartile of stocks in their ranking system during the 1989 to 2014 period where return information is also available for private equity. Please note that they are comparing gross-of-fee returns to net-of-fee returns, and Kaplan and Sensoy estimate private equity fees at 3-4% per year on average. However, even if we add back 4% per year to the PE index, we are comparing 24.70% to 19%. Of course, there is a vast difference in volatility (we’ll discuss this later).
Top Quartile Leveraged Small Value Stocks and Private Equity Returns: 1989-2013
| Top Quartile Leveraged Small-Cap Value (Gross) | Private Equity (Net) | |
| Average Annual Returns | 24.70% | 15.00% |
| Annual Std. Deviation (based on yearly returns) | 51.10% | 13.90% |
| Annual Return / Annual Std. Deviation | 0.48 | 1.08 |
Note, these figures are not available in the paper, but the authors provided this information upon request. The private equity returns are from the Cambridge Associates Private Equity Index
The results are hypothetical results and are NOT an indicator of future results and do NOT represent returns that any investor actually attained. Indexes are unmanaged, do not reflect management or trading fees, and one cannot invest directly in an index. Additional information regarding the construction of these results is available upon request.
A multifactor regression of the top quartile-ranked leveraged small value stocks against the three Fama-French factors, momentum and the Pastor-Stambaugh liquidity factor shows a risk-adjusted return (alpha) of 12.3% per year, which is statistically significant. The strategy has a high market beta and positive betas to the size (SMB) and value (HML) factors. Moreover, as expected for a value strategy that benefits from reversion to the mean, the beta to momentum (MOM) is negative. Finally, the beta to liquidity risk (LIQ) is not statistically significant so there is no evidence that exposure to market-wide liquidity shocks is a driver of the strategy’s returns.
Top Quartile Leveraged Small Value Multifactor Regression Results: 1968 – 2013
| Alpha | MKT-RF | SMB | HML | MOM | LQD | |
| Top Quartile Portfolios | 12.33% | 1.41 | 1.09 | 0.77 | -1.11 | -0.34 |
| (t-statistic) | 2.81 | 8.29 | 4.24 | 3.42 | -4.78 | -1.34 |
The results are hypothetical results and are NOT an indicator of future results and do NOT represent returns that any investor actually attained. Indexes are unmanaged, do not reflect management or trading fees, and one cannot invest directly in an index. Additional information regarding the construction of these results is available upon request.
The Drawbacks to Private Equity Replication
There is, however, a significant challenge in implementing this strategy: leveraged small-cap value stocks exhibit a stomach churning level of volatility, nearly three times as high as private equity’s reported volatility. The strategy’s maximum drawdown from August 2007 to March 2009 was 78%, relative to 59% for the broader Russell 2000 index.
Private equity appears to have a significantly higher Sharpe Ratio than the equivalent strategy in public markets. There are, however, reasons to be skeptical that private equity as an asset class truly has a Sharpe Ratio of 1 and that the volatility reported by private equity firms is less than that of small leveraged stocks that are publicly traded.
Yale’s David Swensen notes in Pioneering Portfolio Management:
“The inability to determine a true market price for private assets forces one to use appraisal-based prices that typically lead to artificial smoothing of the returns.”
Swensen’s thesis has been backed up by recent research by Kyle Welch at Harvard Business School that found that opaque and inconsistent accounting practices in private equity result in systematically deflated estimates of risk in the space.
Regardless, the volatility associated with leveraged small-cap value stocks is a significant risk to investors, who have a tendency to buy high and sell low. But for a buy-and-hold investor, the returns could be worth the price of the volatility. Since 1964, the private equity replication strategy has had a positive return in 91% of rolling 3-year periods and would have beaten private equity in 60% of rolling 3-year periods. Over a longer period, the strategy also has an edge relative to the Fama-French Small Value Index (note that the private equity index is net of fees).
Rolling Win Rates of Leveraged Small Value (1987 to 2014)
| 3-Yr Rolling | 5-Yr Rolling | 10-Yr Rolling | |
| Leveraged Small-Cap Value vs. Private Equity | 60% | 70% | 72% |
| Leveraged Small-Cap Value vs. Fama-French Small-Cap Value | 56% | 52% | 64% |
The results are hypothetical results and are NOT an indicator of future results and do NOT represent returns that any investor actually attained. Indexes are unmanaged, do not reflect management or trading fees, and one cannot invest directly in an index. Additional information regarding the construction of these results is available upon request.
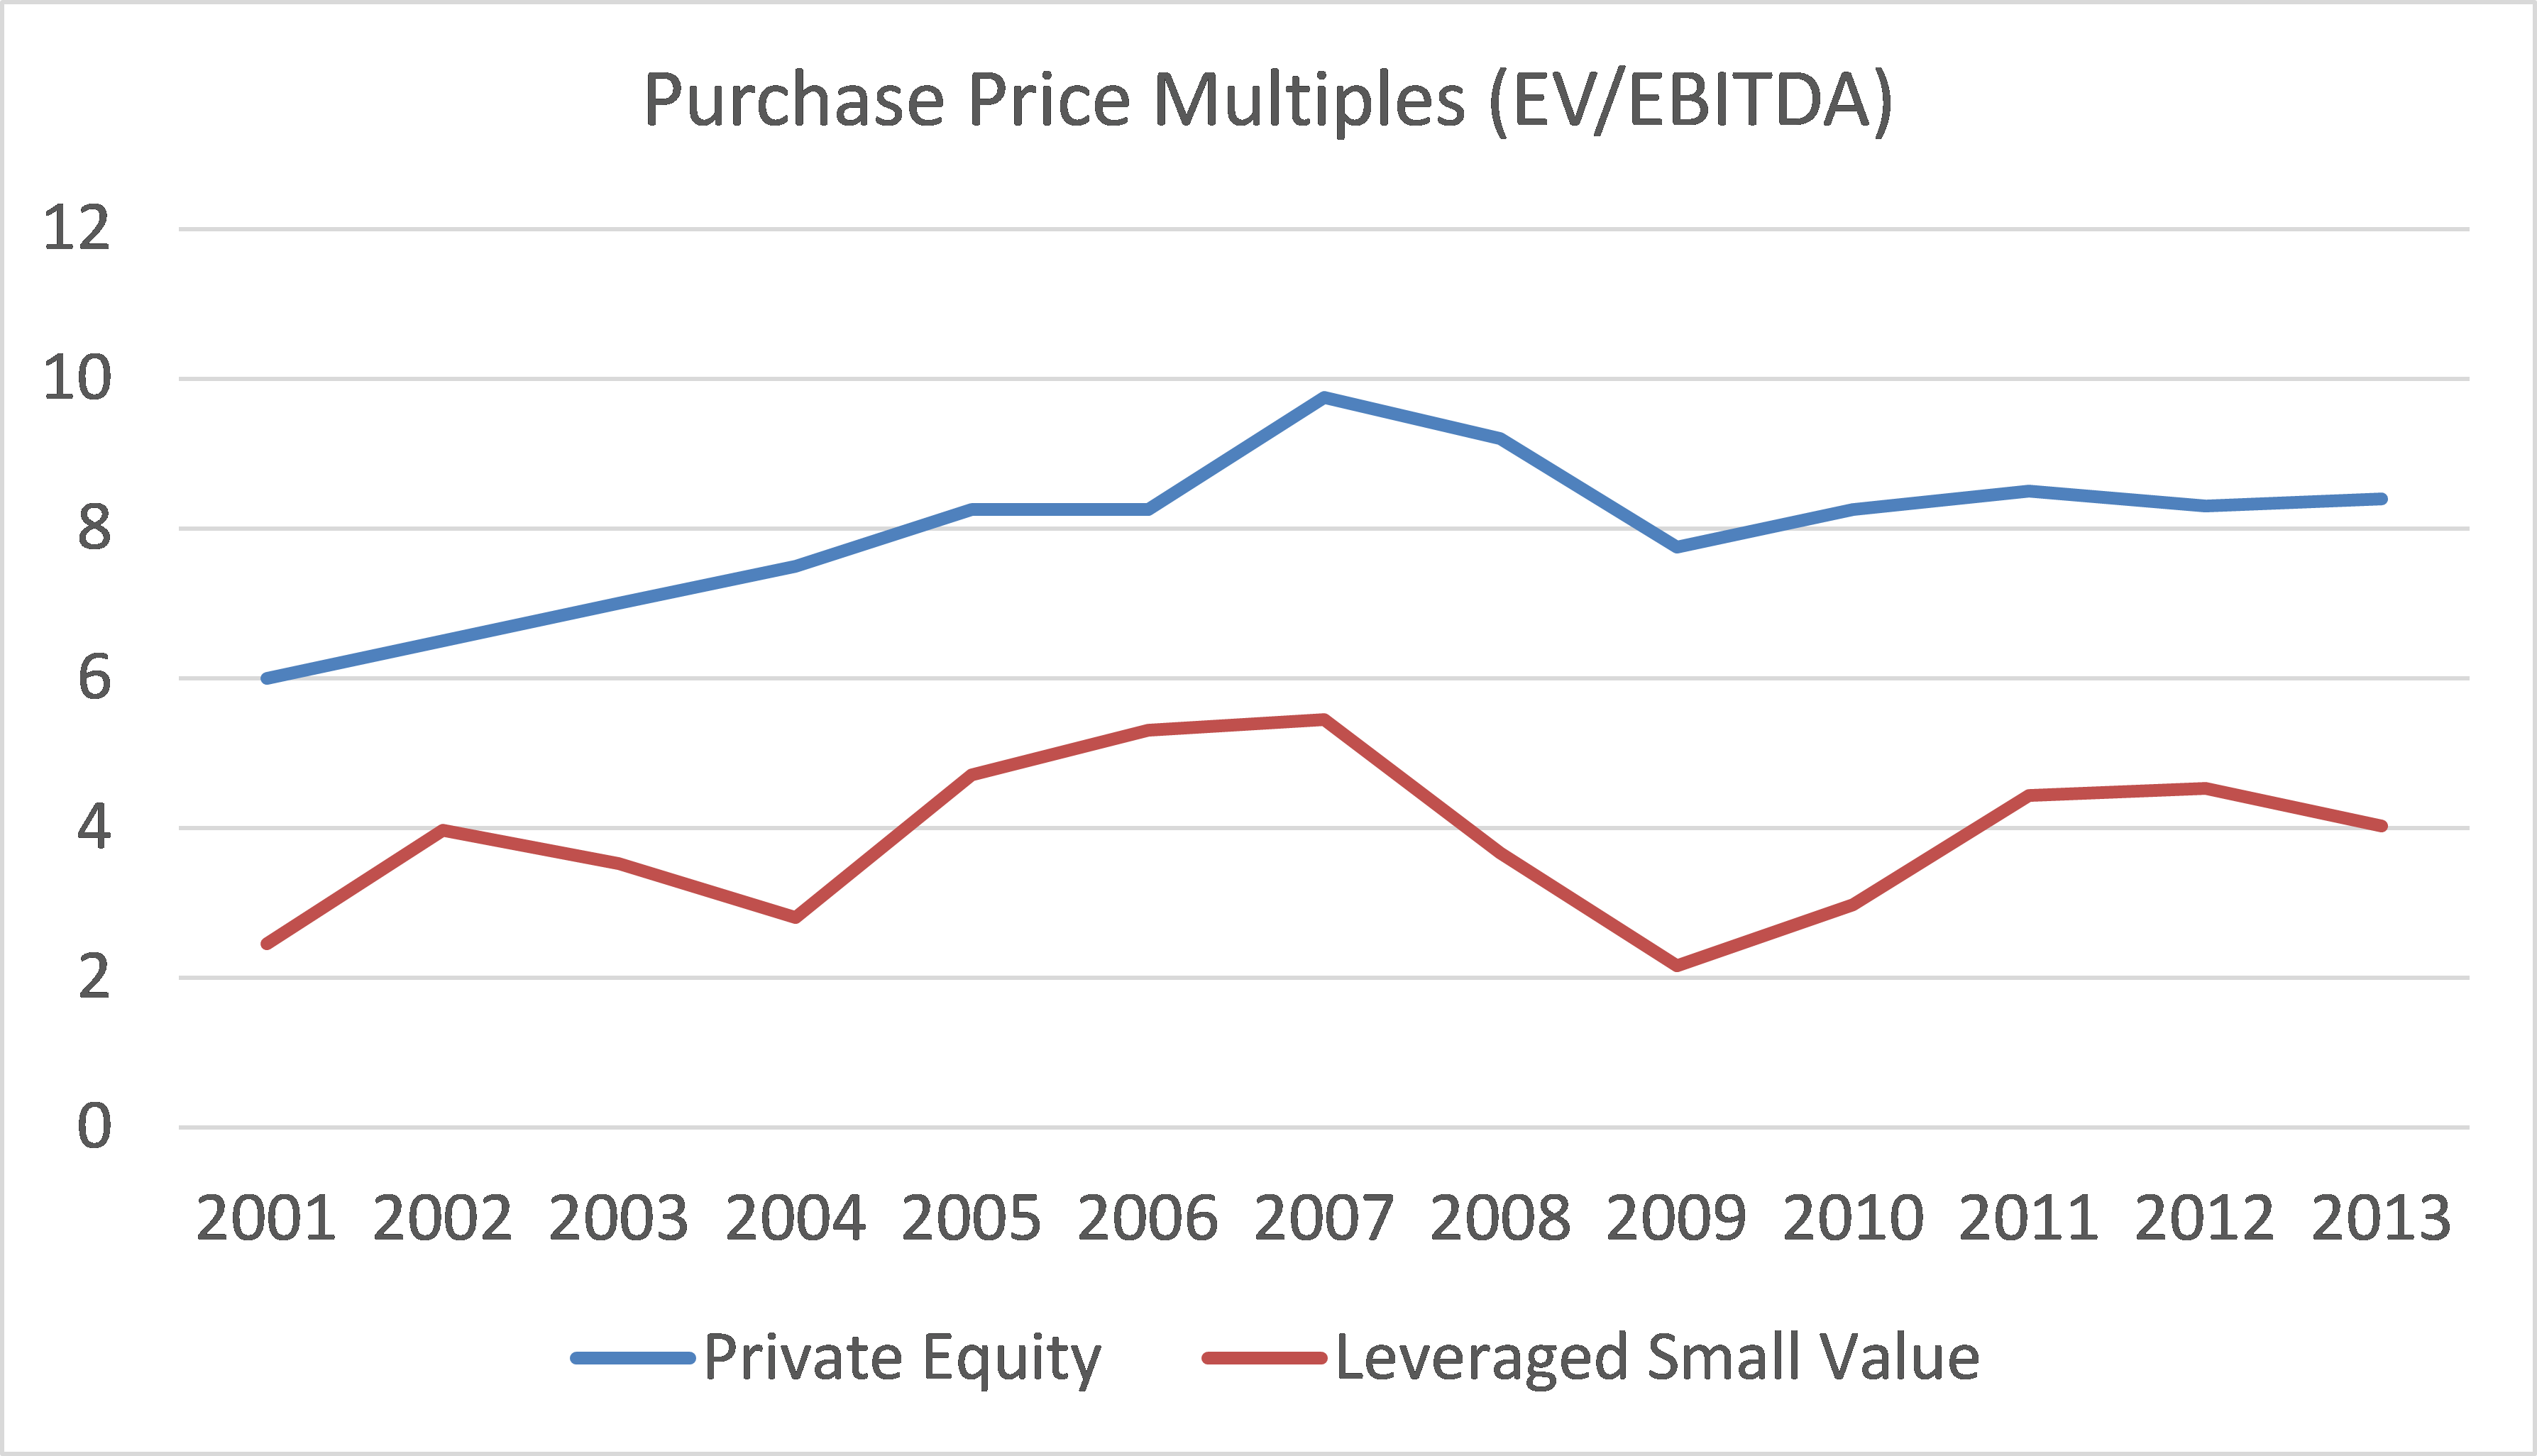
And, as to whether this strategy is likely to continue to beat private equity, valuations are cheaper for leveraged public companies than for LBO deals transacted in private markets. Below, the authors shared data with us that compares the median private equity buyout multiples from Pitchbook to the mean purchase multiple of the top 25 companies in their ranking system:
The results are hypothetical results and are NOT an indicator of future results and do NOT represent returns that any investor actually attained. Indexes are unmanaged, do not reflect management or trading fees, and one cannot invest directly in an index. Additional information regarding the construction of these results is available upon request.
Asset Allocation Implications
For decades, private equity has been the cornerstone of the Endowment Model, popularized by Yale’s CIO, David Swensen. As of 2014, Yale allocated a staggering 33% of its endowment to private equity. However, Swensen correctly notes that private equity exposure is generally unattainable to the average investor because of limitations in terms of accessing the top private equity managers. As a result, his recommended retail portfolios contain 0% private equity.
We believe that the private equity approach developed by Brian and Dan offers great promise as a way for retail and professional investors to access private equity-like returns without many of the headaches. Instead of trusting in private equity managers, with high-fees and low-liquidity, investors can follow a systematic and repeatable strategy that does not suffer from error-prone human judgment.
About the Author: Wesley Gray, PhD
—
Important Disclosures
For informational and educational purposes only and should not be construed as specific investment, accounting, legal, or tax advice. Certain information is deemed to be reliable, but its accuracy and completeness cannot be guaranteed. Third party information may become outdated or otherwise superseded without notice. Neither the Securities and Exchange Commission (SEC) nor any other federal or state agency has approved, determined the accuracy, or confirmed the adequacy of this article.
The views and opinions expressed herein are those of the author and do not necessarily reflect the views of Alpha Architect, its affiliates or its employees. Our full disclosures are available here. Definitions of common statistics used in our analysis are available here (towards the bottom).
Join thousands of other readers and subscribe to our blog.