Have you ever read a news release, thinking you’d see the stock jump 5%, but instead the stock drops 5%?
For example:
- Headline: Apple finds 10,000 pounds of platinum bars in their basement.
- Stock Reaction: Apple down 10%
Now, the example above is extreme, but according to a recent paper, market misreaction to news is not as rare as one would expect.
News Content, Investor Misreaction, and Stock Return Predictability
Using a large dataset of news releases, we study instances of investors’ mistaken reaction, or misreaction, to news. We define misreaction as stock prices moving in the direction opposite to the news when it is released. We find that news tone predicts returns in the cross-section only upon the occurrence of misreaction. Stocks that are larger, more liquid, more visible, and more covered, by analysts or by the media, are less likely to exhibit misreaction. On the other hand, the ambiguity and complexity of news content, and variables that proxy for investor distraction, are all associated with more misreaction and greater predictability.
Here are the core results from the paper:
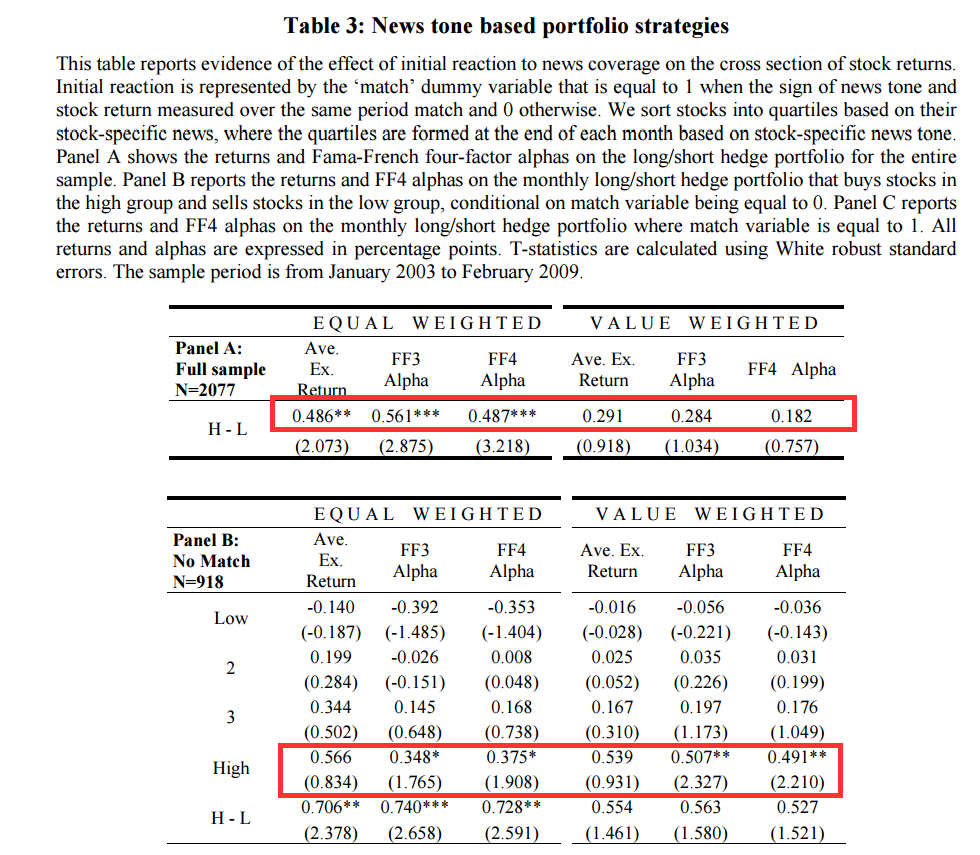
The results are hypothetical results and are NOT an indicator of future results and do NOT represent returns that any investor actually attained. Indexes are unmanaged, do not reflect management or trading fees, and one cannot invest directly in an index. Additional information regarding the construction of these results is available upon request.
High represents portfolios sorted on positive news tone. These portfolios tends to do better than portfolios that have negative news tone. It is a bit odd that the results for the full-sample don’t hold up for value-weighted portfolios, which likely means there is a strong element of size/liquidity potentially driving the results (even though the regressions are supposed to control for this).
About the Author: Wesley Gray, PhD
—
Important Disclosures
For informational and educational purposes only and should not be construed as specific investment, accounting, legal, or tax advice. Certain information is deemed to be reliable, but its accuracy and completeness cannot be guaranteed. Third party information may become outdated or otherwise superseded without notice. Neither the Securities and Exchange Commission (SEC) nor any other federal or state agency has approved, determined the accuracy, or confirmed the adequacy of this article.
The views and opinions expressed herein are those of the author and do not necessarily reflect the views of Alpha Architect, its affiliates or its employees. Our full disclosures are available here. Definitions of common statistics used in our analysis are available here (towards the bottom).
Join thousands of other readers and subscribe to our blog.