The prediction of higher interest rates has been ongoing since the government went all-in on a variety of so-called “inflationary” efforts. Inflation hasn’t happened and rates are still low across the yield curve. So-called “bond vigilantes,” having been wrong for 7 years now and are still calling for inflation and subsequent higher interest rates. Will higher interests happen? I don’t know. Regardless, the point of this piece is not to pontificate on where interest rates will go, but to look back in time and assess what happens when interest rates have risen dramatically.
Before addressing this question, let’s take a look at historical yields.
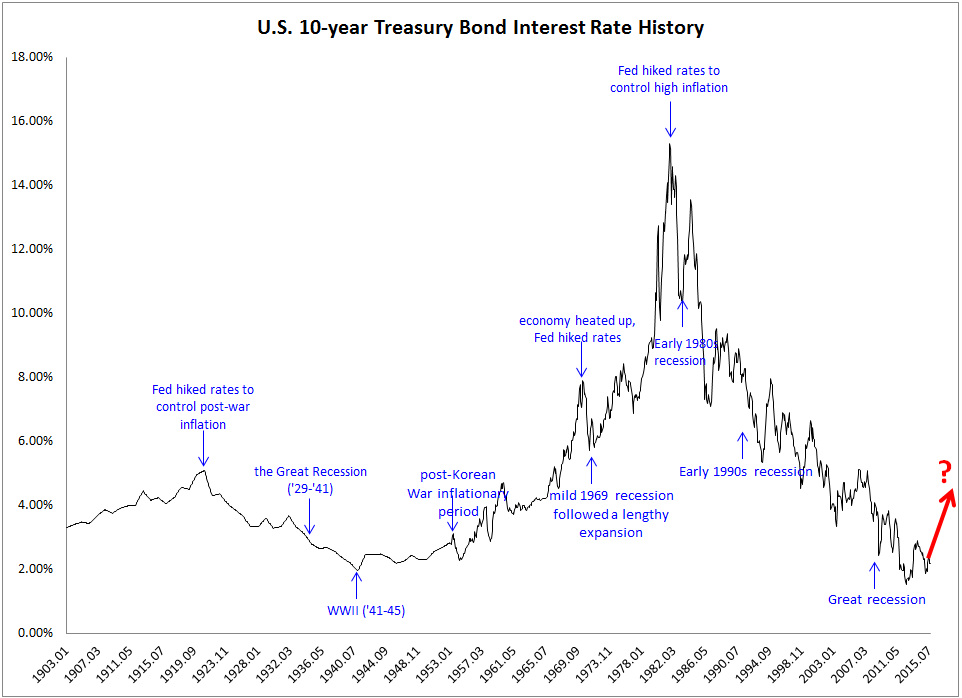
Visualizing 110 Years Of Treasury Yields:
The figure below shows the U.S. 10-year treasury bond rate from 1900 to 2015. We can see that, historically, the Fed has hiked rates to control high inflation, and has lowered rates to stimulate the economy. During the early 1980s recession, inflation rose to double-digit highs, and Paul Volker and Fed took the proverbial “punch bowl” away, raising rates to over 15%. It was at this point, in 1981, that the 35-year bull market for bonds began.
The results are hypothetical results and are NOT an indicator of future results and do NOT represent returns that any investor actually attained. Indexes are unmanaged, do not reflect management or trading fees, and one cannot invest directly in an index. Additional information regarding the construction of these results is available upon request. Event source: http://www.businessinsider.com/the-10-year-us-treasury-note-since-1790-2013-4
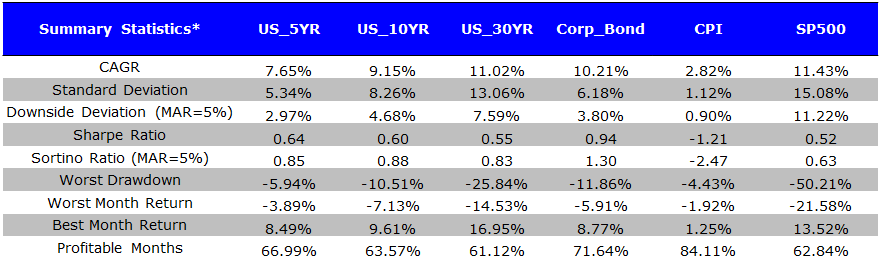
From 9/1981 (interest rate peak) to 9/2015, the compounded annualized growth return (CAGR) for US 10-year treasury bond was 9.15%, with an attractive Sharpe ratio of 0.6. Over the same period, the CAGR for SP500 was 11.43%, with a Sharpe ratio of 0.52. The worst drawdown for the US 10-yr bond was only -10.51% while for the SP500 it was a staggering -50.21%.
The results are hypothetical results and are NOT an indicator of future results and do NOT represent returns that any investor actually attained. Indexes are unmanaged, do not reflect management or trading fees, and one cannot invest directly in an index. Additional information regarding the construction of these results is available upon request.
Today, rates are at historically low levels, but investors think this can’t last very long (even though the market has predicted rate hikes for the past five years.)
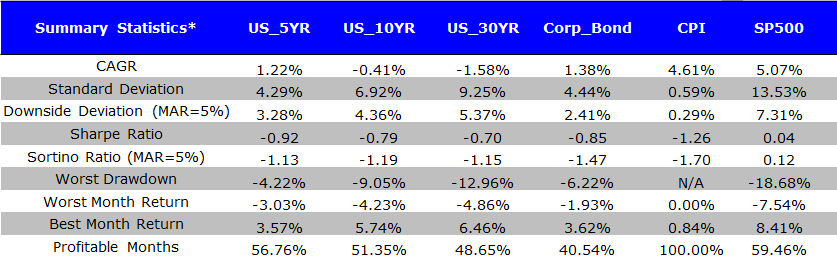
Finally, here is a chart of bond performance and inflation. As expected, there is a negative relationship between bond performance and inflation.

The results are hypothetical results and are NOT an indicator of future results and do NOT represent returns that any investor actually attained. Indexes are unmanaged, do not reflect management or trading fees, and one cannot invest directly in an index. Additional information regarding the construction of these results is available upon request.
With some baseline stats out of the way now we can ask the question: What happens to bonds when interest rates spike?
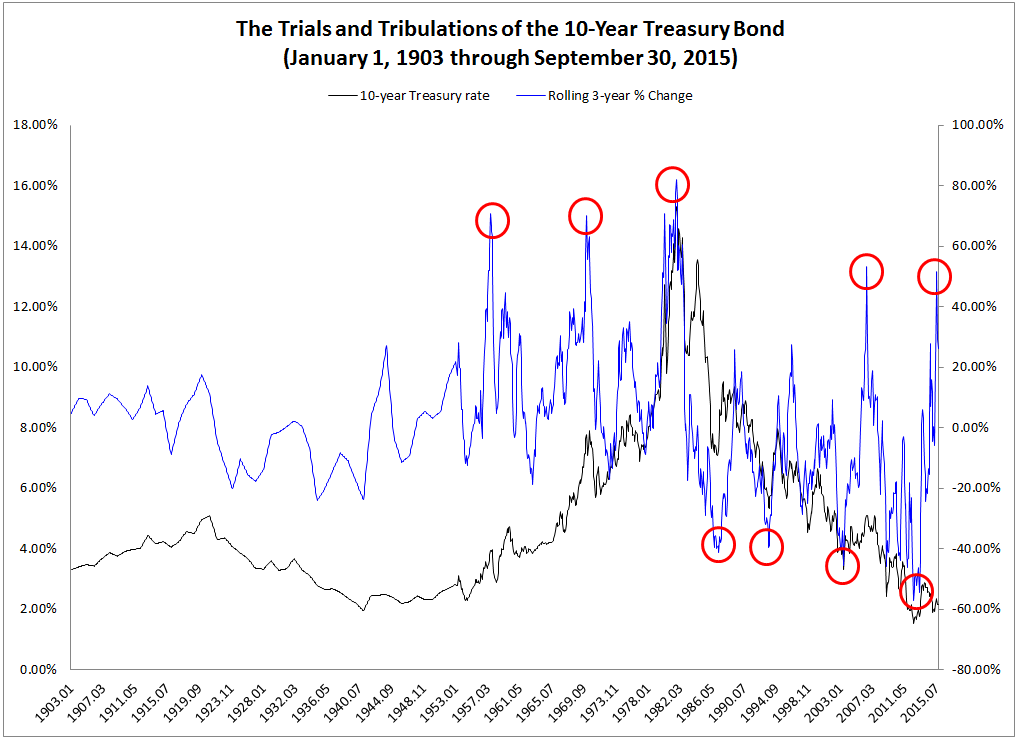
The Trials and Tribulations of the 10-Year Treasury Bond
We calculate the rolling 3-year % change of 10-yr treasury bond rate from 1900 to 2015, and add it to below chart. The data is from Robert Shiller’s Website. The top hikes and top troughs are circled. We want to see how bonds performed during these special, volatile environments.
The results are hypothetical results and are NOT an indicator of future results and do NOT represent returns that any investor actually attained. Indexes are unmanaged, do not reflect management or trading fees, and one cannot invest directly in an index. Additional information regarding the construction of these results is available upon request.
Our study includes 5 asset classes over the sample time period:
- US_5YR: US 5-year Government Bond Total Return Index
- US_10YR: US 10-year Government Bond Total Return Index
- US_30YR: US 30-year Government Bond Total Return Index
- US_Corp_Bond:Dow Jones Corporate Bond Total Return Index
- SP500: SP500 Index
- CPI: Consumer Price Index
Bond Performance in Rising Rate Environments
Based on the 10-year rate, we pick the top 5 rate hikes and see how bonds performed during these spikes.
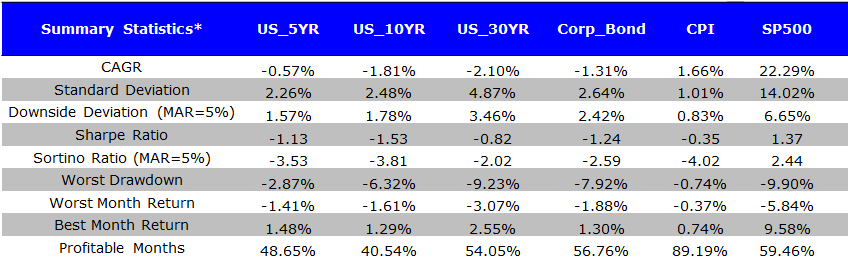
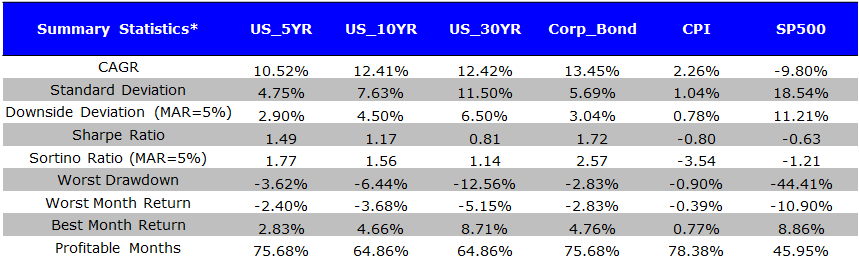
Sept 1978 to Sept 1981: 8.42% –> 15.32% (up 82%)
This is clearly a big move. So what happened?
- Bond suffered poor nominal returns, but not gut-wrenching. Also, note the change in the CPI over this period: real-returns are pretty gut wrenching. Short-term bonds and Mid-term bonds do relatively better because of lower duration.

The results are hypothetical results and are NOT an indicator of future results and do NOT represent returns that any investor actually attained. Indexes are unmanaged, do not reflect management or trading fees, and one cannot invest directly in an index. Additional information regarding the construction of these results is available upon request.
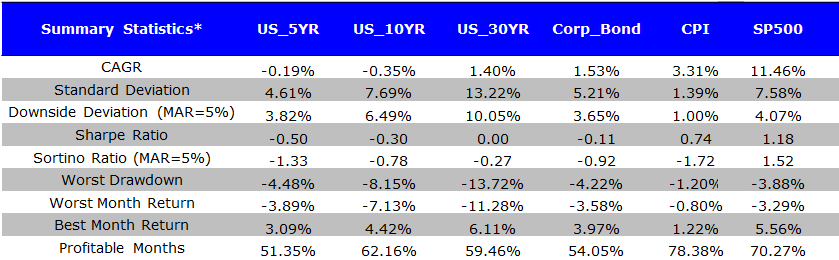
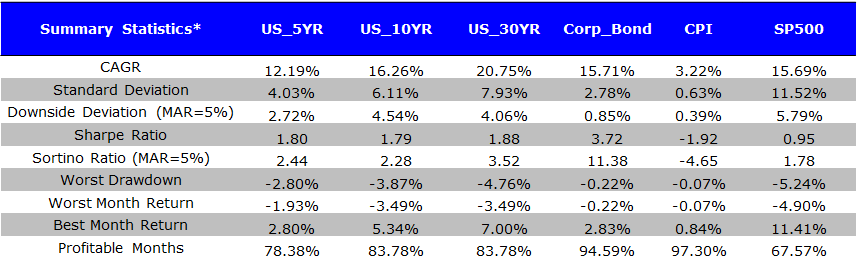
Jan 1967 to Jan 1970: 4.58%–>7.79% (up 72%)
- Poor nominal returns, but not as bad as above. As before, real-returns are still tough. Again, Short-term bonds and Mid-term bonds do relatively better because of lower duration.
The results are hypothetical results and are NOT an indicator of future results and do NOT represent returns that any investor actually attained. Indexes are unmanaged, do not reflect management or trading fees, and one cannot invest directly in an index. Additional information regarding the construction of these results is available upon request.
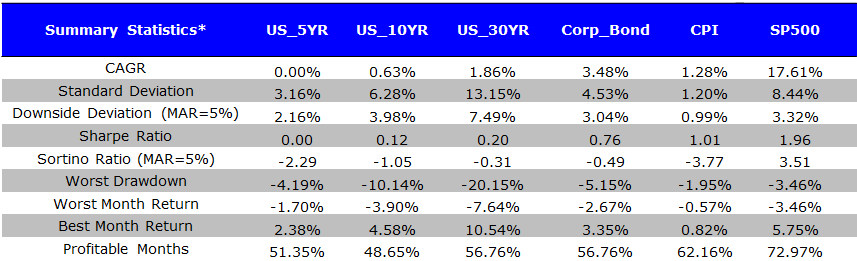
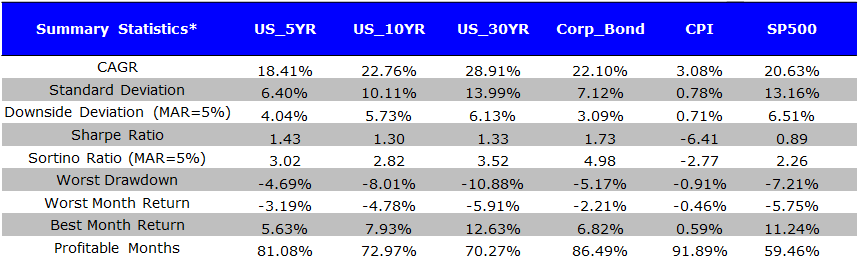
July 1954 to July 1957: 2.30% –>3.93% (up 71%)
- Poor nominal returns and extremely poor returns relative to equity. Real returns are painful. Again, Short-term bonds and Mid-term bonds do relatively better because of lower duration.
The results are hypothetical results and are NOT an indicator of future results and do NOT represent returns that any investor actually attained. Indexes are unmanaged, do not reflect management or trading fees, and one cannot invest directly in an index. Additional information regarding the construction of these results is available upon request.
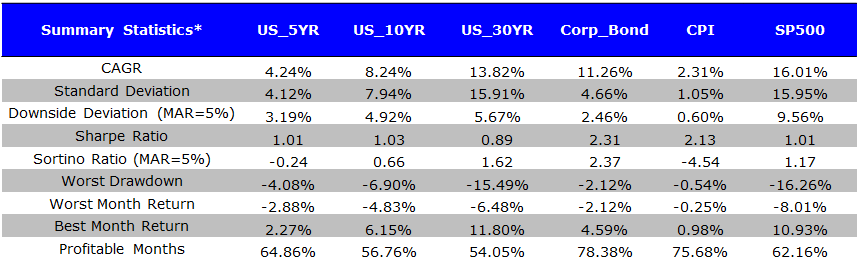
June 2003 to June 2006: 3.33%–>5.11% (up 53%)
- Poor nominal returns, and especially poor returns relative to equity. Real returns painful. As before, Short-term bonds and Mid-term bonds do relatively better because of lower duration.
The results are hypothetical results and are NOT an indicator of future results and do NOT represent returns that any investor actually attained. Indexes are unmanaged, do not reflect management or trading fees, and one cannot invest directly in an index. Additional information regarding the construction of these results is available upon request.
July 2012 to July 2015: 1.53%–>2.32% (up 53%)
- Indifferent nominal and poor real returns, but extremely poor returns relative to equity.
The results are hypothetical results and are NOT an indicator of future results and do NOT represent returns that any investor actually attained. Indexes are unmanaged, do not reflect management or trading fees, and one cannot invest directly in an index. Additional information regarding the construction of these results is available upon request.
Takeaway: During the largest spikes in interest rates, bonds endure pain and these events are scary, but the pain can be quantified and the results aren’t as “scary” as some market commentators suggest. Also, the results emphasize that owning a mix of stocks and bonds is important from a diversification standpoint.
Bond Performance in Falling Rate Environments
Based on the 10-year historical rate, we pick the top 4 peaks for rates and see how bonds performed during these falling rate environments.
June 2009 to June 2012: 3.72%–>1.47% (down 60%)
- Great Performance. Long-term bonds perform better because of longer duration. Corporate bonds perform well too.
The results are hypothetical results and are NOT an indicator of future results and do NOT represent returns that any investor actually attained. Indexes are unmanaged, do not reflect management or trading fees, and one cannot invest directly in an index. Additional information regarding the construction of these results is available upon request.
June 2000 to June 2003: 6.10% –>3.33% (down 45%)
- Great absolute and real performance; especially relative to equity.
The results are hypothetical results and are NOT an indicator of future results and do NOT represent returns that any investor actually attained. Indexes are unmanaged, do not reflect management or trading fees, and one cannot invest directly in an index. Additional information regarding the construction of these results is available upon request.
Sept 1990 to Sept 1993: 8.89%–>5.36% (down 40%)
- Great Performance. Long-term bonds perform better because of longer duration.
The results are hypothetical results and are NOT an indicator of future results and do NOT represent returns that any investor actually attained. Indexes are unmanaged, do not reflect management or trading fees, and one cannot invest directly in an index. Additional information regarding the construction of these results is available upon request.
Aug 1983 to Aug 1986: 11.85% –>7.17% (down 39%)
- Great Performance. Long-term bonds perform better because of longer duration.
The results are hypothetical results and are NOT an indicator of future results and do NOT represent returns that any investor actually attained. Indexes are unmanaged, do not reflect management or trading fees, and one cannot invest directly in an index. Additional information regarding the construction of these results is available upon request.
Takeaway: As expected, bonds perform well in falling interest rate environments.
Conclusion:
Who knows where interests will go–they could go down 50% or they could go up 50%. The exercise above helps us quantify how big interest rates look in practice and how they might affect a portfolio. This data-driven approach is important because it prevents investors from indulging in “fear-based” responses to market commentators who suggest we put all our capital in gold bars buried in our backyard, or on the opposite spectrum, the market commentators who suggest we put all our capital in 30-year zero coupon treasury bonds.
And one comment on the “bury gold bars in the backyard” trade, which would likely be associated with a hyperinflation doomsday-like scenario. We need to understand the context of that environment when/if it ever happened. Basically, from a financial markets perspective we are all dead: bonds are dead; stocks are probably dead; and corruption/barter will rule the land. Unfortunately, gold bars buried in the back yard won’t be the savior, because people with guns (or the government) can steal the gold from those who buried it in their backyard. Having lived and operated in countries that operate in this manner, I don’t think everyone in the “bury gold in your backyard” crowd really understands how that trade would pay off in practice. In many respects, the gold bar trade is akin to the “buy CDS” trade in 2007. Good idea in theory, but when you go to cash-in your insurance from AIG, you find out they are bankrupt and you are left holding the bag (until the government bailed you out).
Long story short, investors would be better served by avoiding “fear instincts” and sticking with simple diversified portfolios with principles outlined in our robust asset allocation framework. Include stocks, include bonds, include inflation-friendly assets, minimize taxes/fees, and so forth. And for those with a more extreme survivor-mentality, keep a small amount of capital dedicated to gold and guns, but don’t tell anyone about it and pray that it never has to pay off :-)
About the Author: Wesley Gray, PhD
—
Important Disclosures
For informational and educational purposes only and should not be construed as specific investment, accounting, legal, or tax advice. Certain information is deemed to be reliable, but its accuracy and completeness cannot be guaranteed. Third party information may become outdated or otherwise superseded without notice. Neither the Securities and Exchange Commission (SEC) nor any other federal or state agency has approved, determined the accuracy, or confirmed the adequacy of this article.
The views and opinions expressed herein are those of the author and do not necessarily reflect the views of Alpha Architect, its affiliates or its employees. Our full disclosures are available here. Definitions of common statistics used in our analysis are available here (towards the bottom).
Join thousands of other readers and subscribe to our blog.