Many in the financial service industry are now using ETFs to build portfolios. Some love the tax-efficiency of ETFs relative to mutual funds, while others use ETFs as trading vehicles. Either way, ETF assets continue to grow at a steady pace, with total ETF assets now over $3 trillion. The question we often get is how ETF trading works? The paper we discuss sheds some light on this question.
An important piece of the ETF landscape is the ETF market-making business. Each day ETF market makers are “making a market” in ETFs, many of which have much lower volumes than the well known ETFs (SPY, EFA, AGG, etc.). When a market maker sells shares in an ETF to an individual in the secondary market, most of the time the market maker is now short the ETF they just sold (assuming the market maker does not keep inventory of an ETF, which can be costly).
So what happens when a market maker is short the ETF?
At some point in the future, they will need to create new ETF shares, or locate/purchase shares to give to the end buyer. However, creating new shares on a daily basis may not be the most efficient use of capital from an operational perspective. As a result, market makers from time to time will fail-to-deliver (FTD). The SEC posts the FTD data on their website here.

Source: https://www.sec.gov/data/foiadocsfailsdatahtm
Understanding How ETF Trading Works
As ETFs continue to grow, it is important to better understand the following:
- What is going on?
- How big/small are the numbers?
- Why market makers may be operationally short and fail-to-deliver from time to time?
A new research paper, titled “ETF Short Interest and Failures-to-Deliver: Naked Short-selling or Operational Shorting?” written by Rich Evans, Rabih Moussawi, Mike Pagano, and John Sedunov investigates this ETF market making activity. We were privy to early tables from the paper (seen around a year ago), and we think it adds to the literature by shedding light on the ETF market making activity, where many in the financial service industry do not really know what is happening.(1).
I was able to sit down with Mike Pagano, a Villanova Professor and friend of the firm (ETF Board Member), and ask a few questions about the paper.
Below are my questions and Mike’s responses:
—
Mike, we’re trying to help our audience get a better understanding of how ETF trading works. You seem like the perfect candidate to address this question.
1) What is a Failure to Deliver? Why is this important?
A failure-to-deliver (FTD) occurs when the seller of a security does not deliver the security on or before the settlement date (typically T+3 days for most investors but ‘bona fide’ market makers get up to T+6 days).
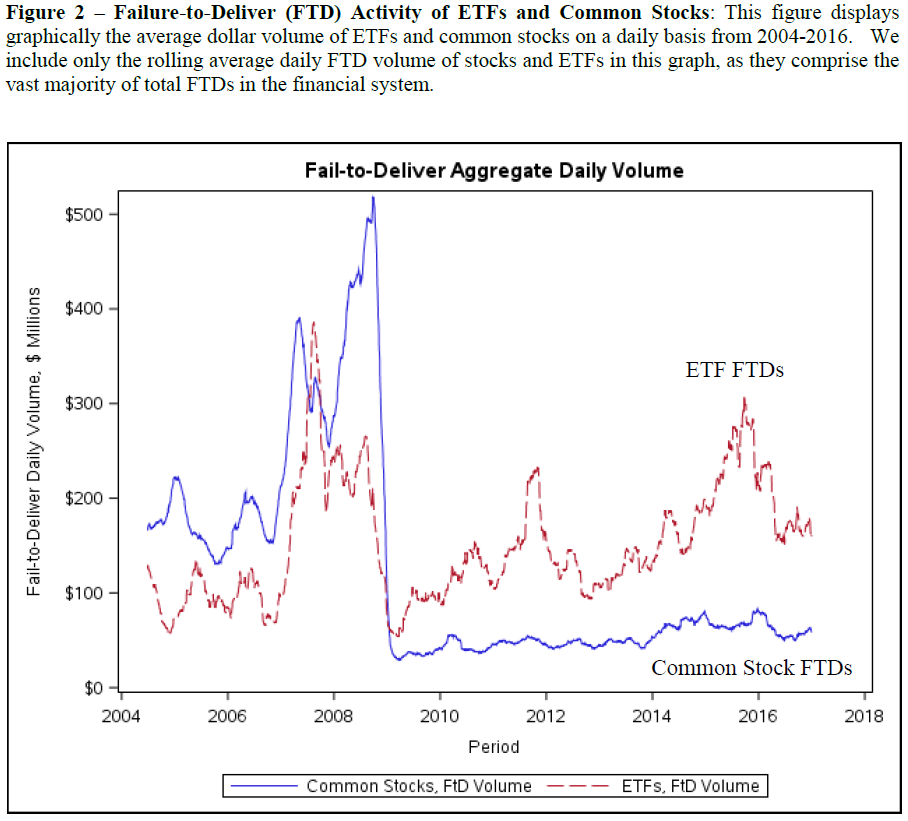
2) In figure 2 of the paper (shown below), you document a large drop-off in FTDs for common stocks in late 2008. Can you explain why this happened?
The large drop-off is due to the SEC enacting a rule (Rule 204) during the 2008 crisis period which prohibited “naked” short-selling of securities listed on U.S. financial markets. This rule, which was made permanent in 2009, requires all market participants to either have in their possession or have located (i.e., borrowed) the securities on the day that they are selling them to another party.
Source: ETF Short Interest and Failures-to-Deliver: Naked Short-selling or Operational Shorting? (accessed 8/1/17)
3) Figure 2 additionally highlights a growing dollar amount of failure to delivers for ETFs, is this simply driven by more capital flowing into ETFs?
We think that two things are operating here. First, the sheer rapid growth in AUM for ETFs clearly supports the notion that there will be more FTDs as these capital inflows continue. Second, we think it might be more difficult to surveil naked ETF shorting activity because APs have the option to either create new ETF shares to cover a short position or enter the secondary market for covering the ETF short position. Thus, it may be unclear whether an AP or other market maker really has a naked position or if they are simply in the process of locating the underlying shares to create a new ETF block. This is in contrast to a market maker in common stock which does not have the option of creating new shares (and thus it is easier to identify illegal short-selling activity).
Source: ETF Short Interest and Failures-to-Deliver: Naked Short-selling or Operational Shorting? (accessed 8/1/17)
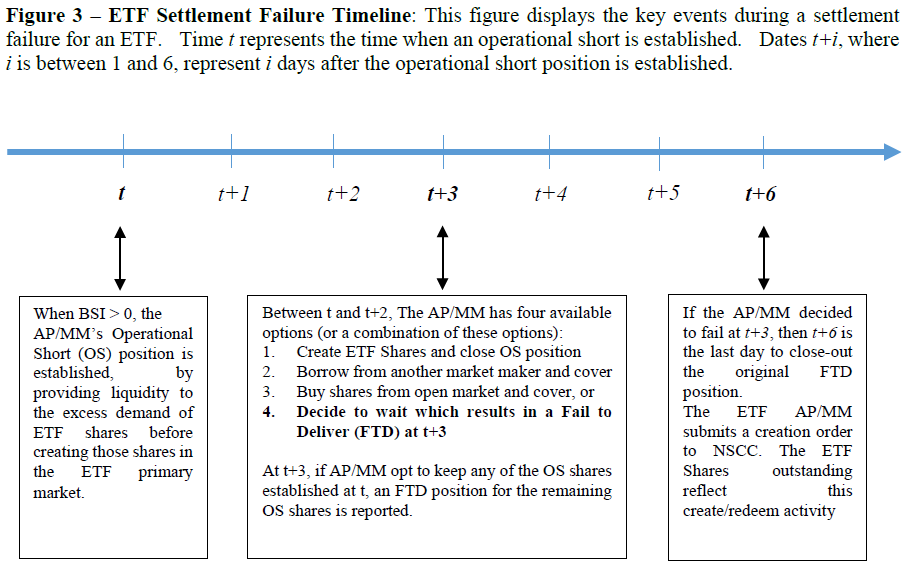
4) Can you explain figure 3 (shown above), the ETF settlement timeline? Is this the same as common stock settlements?
The timeline shows that once a short sale occurs at time t, the trader must deliver the security by t+3 unless the trader’s short sale is part of “bona fide” market making. In this latter case, the trader can take up to t+6 days before it has to deliver the shares. If the “bona fide” market making trader goes beyond t+6, then the trade will be listed by the SEC as a FTD.
Source: ETF Short Interest and Failures-to-Deliver: Naked Short-selling or Operational Shorting? (accessed 8/1/17)
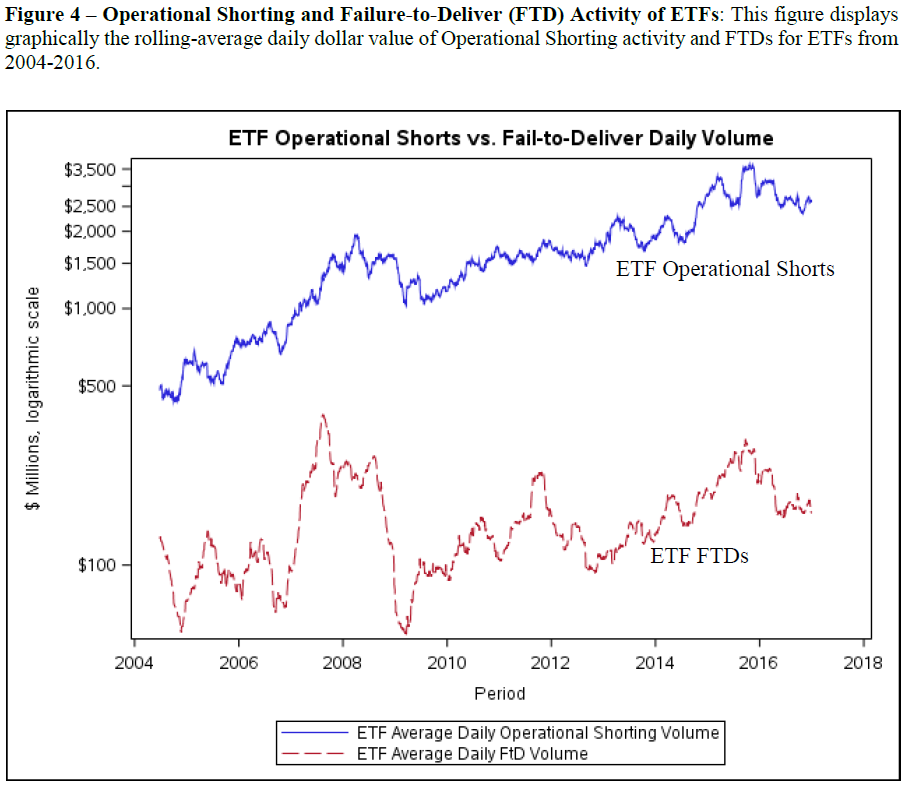
5) In figure 4 (shown above), you highlight ETF operational shorting volume. How do you measure operational shorting in your paper?
This is a novel measure that we have devised for the purpose of quantifying how much short-selling activity could be viewed as naked short selling due to an AP’s normal, “bona fide” market-making activity. Over the past 3 days, we categorize all trades into either buyer-initiated or seller-initiated trades and then cumulate the net difference in these “buy” vs. “sell” trades to get a sense of the net buying or selling pressure on an ETF. We then subtract the next day’s actual change in shares outstanding for the ETF because this represents creation activity that might cover cumulative buy-sell trade imbalance. In our definition, there is zero naked shorting related to market-making activities if, say, there’s a positive buy-sell imbalance of 100,000 shares that is exactly offset with an increase in ETF shares outstanding of 100,000 shares once the T+3 deadline occurs. We find that this measure of operational shorting is positively related to FTDs and overall financial market stress (while also helping to reduce arbitrage opportunities and improve the liquidity of the underlying securities held by a specific ETF). Thus, operational shorting appears to have positive benefits at the “micro” level of an individual ETF but might also have negative effects at the “macro” level of the overall financial market due to increased counterparty risk.
5a) As a follow-up on how operational shorting is measured, I found the Appendix example interesting. Can you please explain what the pros and benefits are for an AP in your model? In other words, why would an AP operationally short?
An AP usually has an economic incentive to engage in operational shorting (i.e., selling shares without fully covering this position within T+3 days) whenever the buy-sell trade imbalance is mean-reverting. For example, if there is a positive buy-sell imbalance due to “excess” buying pressure, the AP can sell shares that it does not currently possess at a relatively high price (e.g., above the NAV) and then wait for the order imbalance to mean-revert to, say, a negative position where there is “excess” selling pressure. Then, at that later time, the AP can buy some ETF shares in the secondary market to cover its short position without having to incur costs to create a new ETF unit and accumulate the underlying securities in the ETF basket. By avoiding ETF creation fee costs and transaction costs in the underlying securities, the AP can increase its net return on its capital outlay (and without incurring price risk if it also uses a futures hedge).
6) How does operational shorting affect bid/ask spreads?
We find in Table 9 that the bid-ask spreads of the underlying securities held by ETFs are improved when there is more operational shorting (and intraday volatility decreases). So, we conclude that operational shorting can improve the liquidity of the underlying securities. We do not perform direct tests of the bid-ask spreads of the ETFs in our current draft but we find in Table 6 that a greater liquidity “mismatch” between the ETF’s bid-ask spread and the underlying stock’s bid-ask spread is positively related to operational shorting. This suggests that ETFs that are much more liquid than their underlying securities will engage in more operational shorting, possibly for APs to avoid the high costs of creating a new ETF block with a relatively illiquid basket of stocks.
7) What does the literature generally say about shorting as far as it being predictive of future returns? Does operational shorting provide information about future returns for stocks (similar to other papers have found)?
What is interesting here is that prior literature has focused on the informational content of short-selling in general rather than trying to parse out how much of shorting activity might be “operational” in nature (i.e., due to the normal daily provision of liquidity by APs). Thus, prior papers which have focused on total short-selling have usually found a negative relation between shorting and future stock returns (due to “informed” traders taking advantage of negative news). However, when we focus on the portion of short-selling that we attribute to typical liquidity provision, we find no significant relation with future returns. This finding is consistent with many market microstructure theories which assume market makers do not have any special information that would make their trades predictive of future returns.
8) You mention operational shorting in the context of financial system stress in the paper. Can you explain your findings here?
As mentioned in response to question 5 above, we find that our measure of operational shorting is positively related to FTDs and overall financial market stress. Thus, operational shorting appears to have positive benefits at the “micro” level of an individual ETF by improving the underlying basket’s liquidity but might also have negative effects at the “macro” level of the overall financial market due to increased counterparty risk. The reason for this is that an increase in operational shorting essentially means increased naked short positions (most likely driven by APs’ liquidity provision) that ultimately lead to increased FTDs and thus greater counterparty risk. When we aggregate our operational shorting measure at the market-wide level, we see that this metric is positively related a system-wide risk measure such as the St. Louis Fed’s Financial Stress Index.
Concluding Thoughts
The paper gives a good background on ETF market making activity and why market makers operationally short. I highly recommend reading the paper to better understand how ETF trading works.
Let us know what you think!
ETF Short Interest and Failures-to-Deliver: Naked Short-selling or Operational Shorting?
- Richard B. Evans, Rabih Moussawi, Michael S. Pagano, and John Sedunov III
- A version of the paper can be found here.
Abstract:
While ETFs constitute just under 10% of U.S. equity market capitalization, they account for over 20% of short interest and nearly 79% of failures-to-deliver in U.S. equities. While the disproportionate share of short activity in ETFs has raised concerns about excessive shorting and naked short-selling, we identify an alternative cause for this activity related to the market making activities associated with the ETF creation/redemption process, which we label “operational shorting.” We propose a simple methodology to estimate operational shorting and show that our measure is consistent with the economics behind the mechanism. In examining the market implications of operational shorting, we find that it is associated with improved ETF liquidity but that it is also predictive of market-wide indicators of systemic and counterparty risk. In exploring possible mechanisms for this predictive relationship, we find there is commonality in operational shorting across ETFs that have the same lead market maker/authorized participant and that market makers’ financial leverage might be a channel that amplifies this commonality, both of which are suggestive of an increase in counterparty risk.
About the Author: Jack Vogel, PhD
—
Important Disclosures
For informational and educational purposes only and should not be construed as specific investment, accounting, legal, or tax advice. Certain information is deemed to be reliable, but its accuracy and completeness cannot be guaranteed. Third party information may become outdated or otherwise superseded without notice. Neither the Securities and Exchange Commission (SEC) nor any other federal or state agency has approved, determined the accuracy, or confirmed the adequacy of this article.
The views and opinions expressed herein are those of the author and do not necessarily reflect the views of Alpha Architect, its affiliates or its employees. Our full disclosures are available here. Definitions of common statistics used in our analysis are available here (towards the bottom).
Join thousands of other readers and subscribe to our blog.