- Title: WHAT DIFFERENCE DO DIVIDENDS MAKE?
- Authors: C. Mitchell Conover, CFA, CIPM, Gerald R. Jensen, CFA and Marc W. Simpson, CFA
- Publication: Financial Analysts Journal, Volume 72, Number 6, 2016 (version here)
What are the research questions?
Research has shown that dividends constitute a greater contribution to the returns of a value versus a growth strategy. However, the question remains as to whether or not dividends matter within a style category.
- For style investors, does dividend policy determine success relative to non-dividend payers while holding investment style constant? When choosing stocks within an investment style, specifically growth, value, small cap, or large cap, does the level and yield of dividends influence the performance of the strategy?
- Is there evidence for clientele effects? That is, are stock return patterns associated with the restrictions or preferences that investors place on style selection regarding the level of dividend payments?
- Is there an optimal dividend tilt across the range of market capitalizations? As a style, the market cap of a company may influence the risk and return profiles for stocks across various levels of dividend yields. For example, within a market cap strata, do the risk/return profiles differ for low to high dividend yields compared to non-dividend payers?
What are the Academic Insights?
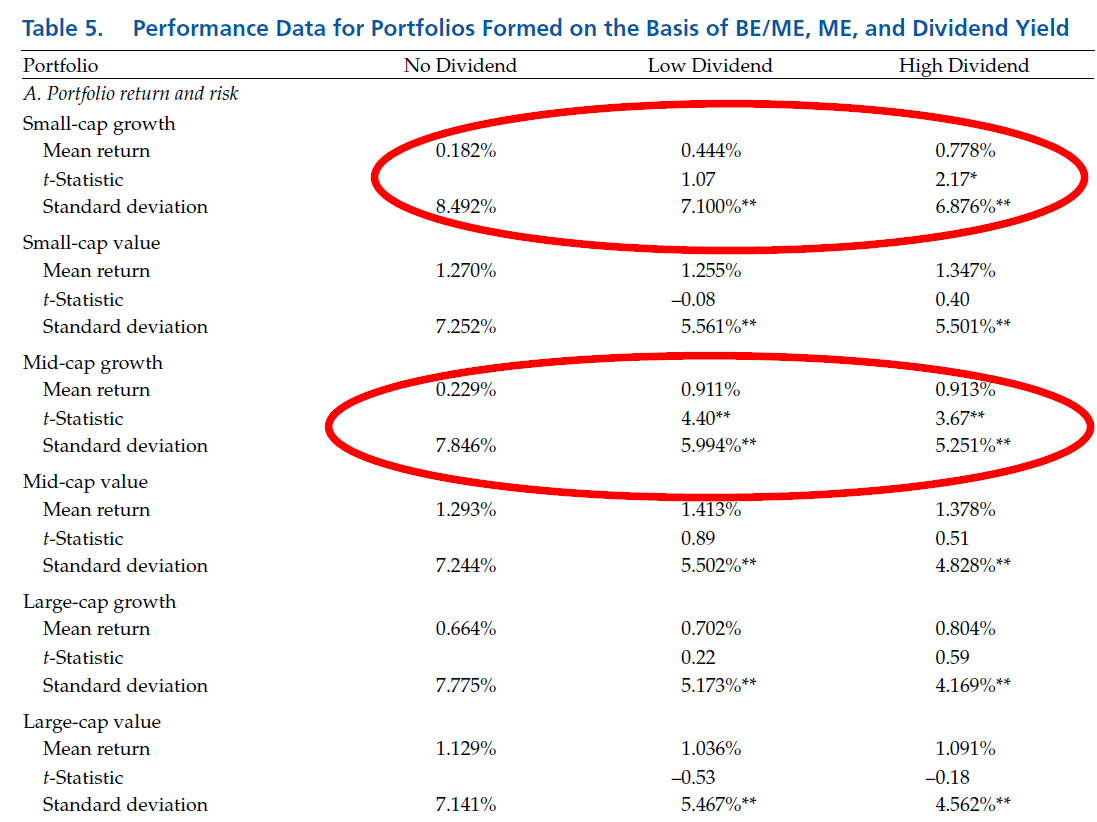
- YES. There is ample evidence that style based investors have much to gain by considering the level of dividends paid by a stock. Within equity styles, small cap (low ME) and growth (low BE/ME) were the best-performing styles for high dividend paying stocks vs. their counterparts that paid no dividends. Small cap growth stocks outperformed all other combinations of style. A surprising result in that those are the very groups that investors assume would withhold dividends in favor of reinvestment. The mean return for growth stocks (low BE/ME) paying high dividends exceeded the no dividend stocks by .251% per month. The mean return for small cap high dividend payers exceeded small cap/no dividend payers by .258%. The standard deviation of returns for small cap, growth styles were also smaller for high dividend payers vs. the same style for non-dividend payers.
- YES. It appears that clienteles are created by preferences for equity style (growth vs. value) or tax avoidance (dividends vs. non-dividends) and these preferences then form the basis for a relationship between stock returns and dividend yield and market ratio. Fundamentally, the growth strategy would deliberately target non-dividend payers in the small cap area in a search for stocks with very high future growth prospects. Yet, this strategy turns in abysmal performance in that small/midcap growth stocks that pay no dividends produce among the very lowest realized returns, 0.182% and 0.229%, respectively. Even more distressing is that these lower returns are delivered with the very highest risk profiles than any other portfolio of the dividend paying groups.
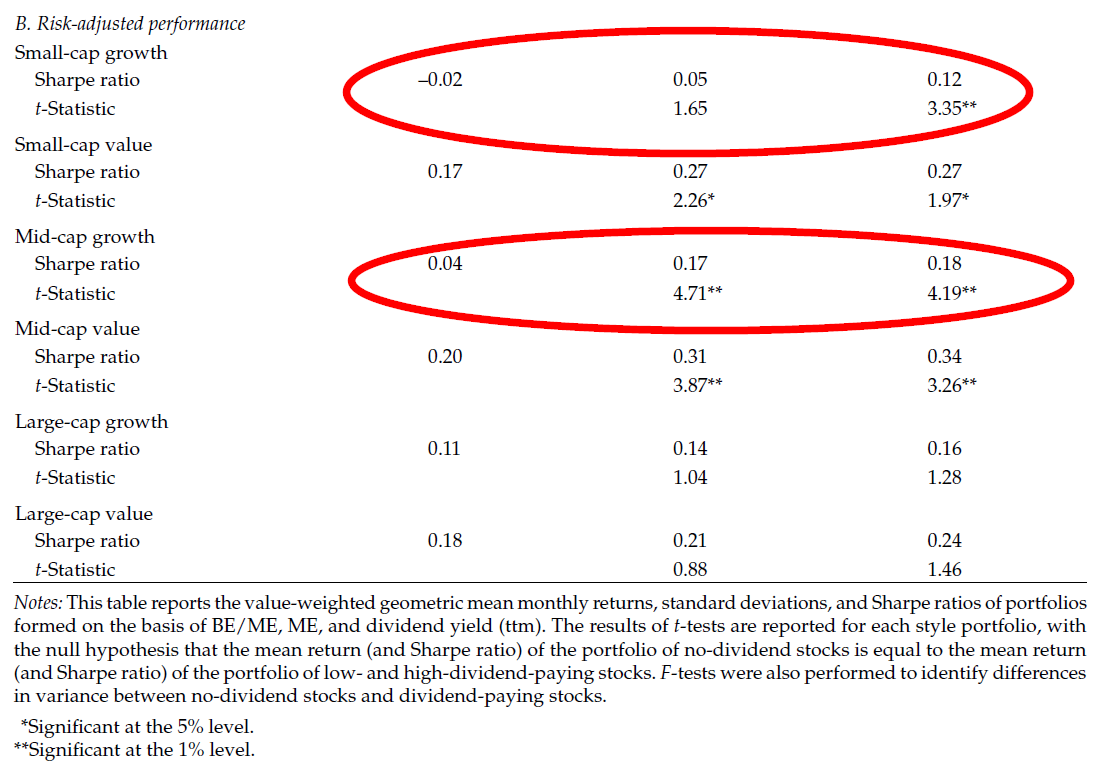
- YES. The risk and return benefits of focusing on dividend payers varied widely depending on equity style and/or market capitalization. With the exception of large cap stocks, growth investors would in every other case improve monthly returns by focusing on high dividend paying stocks. The largest gain occurred in the small cap area where returns increased significantly from .182% (no payers) to .778% (high payers). A similar quadrupling of returns was observed for midcap growth portfolios that focused on high payers vs. no payers of dividends (.229% to 0.913%). For large cap growth and value investors, a focus on high dividends produced little to no effect. Significant improvement in Sharpe ratios were noted for small and midcap categories. The risk-adjusted performance improved significantly and was the largest for the midcap groups.
Why does it matter?
One of the strengths of this paper is the long time frame studied, especially when compared to previous work. The sample was comprised of 50 years of data, from 1962 to 2014, covering numerous market cycles and during which dividend yields varied from 1.1% to 5.6%. The analysis was made more reliable by separating out stocks that paid extremely high dividends, into separate portfolios. The major results discussed here were specific to the no dividend, low and high dividend portfolios, excluding the atypical effects from the extreme portfolio. The 2007 study conducted by Fama and French examined the effects of dividends across portfolios with strong growth and strong value exposures. Essentially, the 2007 analysis determined the “market price” of a dividend exposure while controlling for growth and value attributes.
In contrast, this study looks at the effects of dividends within growth/value/market cap styles. This research design provides an interesting and surprising perspective on the use of dividends in building growth portfolios. Indeed, the level of the dividend payout provides information about factors that differentiate among growth stocks in the small and midcap universe. Practically, speaking, for the growth investor and other practitioners, the major finding is compelling. Introducing a high dividend exposure in the midcap and small cap universes of growth stocks (low BE/ME) produced a significant increase in the monthly return (a four-fold increase). A high dividend payout also had a comparable impact on the risk to variability metric for growth and value universes.
What is the most important chart in the paper?
About the Author: Tommi Johnsen, PhD
—
Important Disclosures
For informational and educational purposes only and should not be construed as specific investment, accounting, legal, or tax advice. Certain information is deemed to be reliable, but its accuracy and completeness cannot be guaranteed. Third party information may become outdated or otherwise superseded without notice. Neither the Securities and Exchange Commission (SEC) nor any other federal or state agency has approved, determined the accuracy, or confirmed the adequacy of this article.
The views and opinions expressed herein are those of the author and do not necessarily reflect the views of Alpha Architect, its affiliates or its employees. Our full disclosures are available here. Definitions of common statistics used in our analysis are available here (towards the bottom).
Join thousands of other readers and subscribe to our blog.