As you are no doubt experiencing, stock market volatility has spiked this year with the S&P 500 dropping or rising 2% or more on eight different days. Jolts of this size didn’t happen at all in 2017.
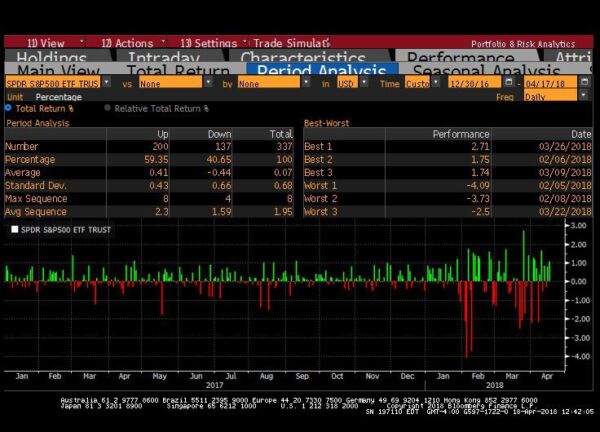
The ramp up in volatility serves as a good opportunity to expand on the idea that long-term investors’ response to market volatility should be muted. In short, when prices drop, expected returns often increase. Those that react by trying to get off the ride by trading in and out of the market sadly have little evidence to support their urge. More, volatility spikes can bring benefits to long-term investors. For example, volatility may allow investors to harvest losses (generating higher after-tax returns) and could help keep the equity risk premium high (i.e., if expected volatility were permanently lowered, equity market expected returns would drop).(1)
To build a theoretical and empirical base for this conclusion, I will review a few key concepts associated with modern portfolio theory: Discount Rates, Expected Return Models, and Predictive Models. I will often reference articles by Prof. John Cochrane, current author of the blog “The Grumpy Economist,” a one-time University of Chicago professor and now a Senior Fellow at the Hoover Institute at Stanford. Prof. Cochrane’s articles are more comprehensive and mathematically robust than space (or talent!) allow for in this article, so my goal is to instead share the intuition behind some of these key tenants without the math.
Let’s start with the basics…
Discount Rates
The value of any asset is simply the sum of distributions adjusted for the 1) timing and 2) risk of the payments. With respect to timing, investors typically want their payments sooner rather than later, so future payments are less valuable than current cash (i.e., they sell at a discount). Regarding risk, when the value of the future payment is uncertain, this payment will receive a discount relative to a payment with no risk. What does a discount represent in a market? Well, whoever is buying this asset with a right to the risky cash flow will pay a discount to the face value of the cash flow so they can earn a higher expected return. Discount rates and expected returns are directly tied together (in theory).
Granted, a speculator in Cryptocurrencies may be wagering that someone else will eventually pay more in the future because of its potential role as a store of value. Similarly, a buyer of natural gas might pay-up for the convenience of owning it now versus the promise of owning it in the future. To simplify things, though, I’m going to assume the payments are in cold hard cash. And although I enjoy John Maynard Kayne’s metaphor that the stock market is like a beauty contest, I also appreciate that in practice, he was more of a value investor that used discount rates, and thus, I will also assume that investors can’t predict the fickleness of their fellow investors.
As a simple example, the current price of a bond is simply the summation of all of its future discounted coupons and principal payments. If a bond buyer feels that the rate to determine this discount (aka, the discount rate) is equal to the bond’s promised coupon payments she expects to receive (aka, earn), she will pay the full current face value of the bond. If she changes her mind and determines that the odds of a recession just increased such that she has less comfort that she’ll be paid back, she might increase her discount rate and the price she is willing to trade at will drop. On the flip side, if she feels her bond is free of default risk but a good place to hide, she might be willing to lower the expected return she needs to hold the bond and only be willing to trade it at a premium. Higher levels of change in the underlying discount rate for bonds leads to higher volatility in bond prices.
Stocks are really no different.
Instead of coupon payments, stocks pay their shareholders via dividends (or indirectly through stock buybacks, but we’ll save the discussion of the differences for another piece). These payments often grow, so unlike a bond payment, dividend’s have an associated growth rate. The resulting price for a stock is then all of its future expected dividends discounted back at the expected return. The return is simply the current dividend divided by the current price (its dividend yield) plus the growth rate (for the derivation of the formula, Wikipedia does a nice job).
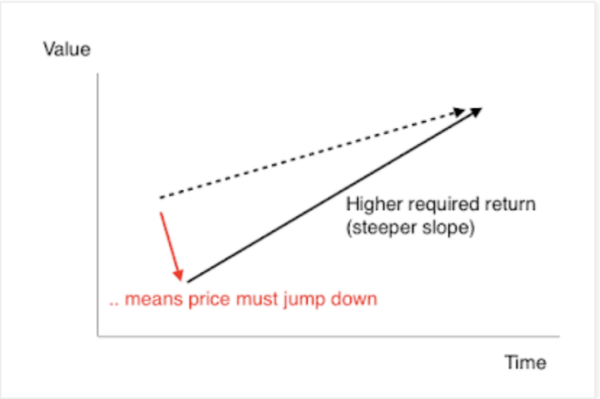
When stock prices are moving rapidly, then either the return investors demand for holding stocks, or their expected growth rates, are changing. But as John Cochrane discusses in his blog post, “Stock Gyrations,” bad news about the stock market going down can be good news about future expected returns (aka discount rates) for stocks.
I’ll snag the Professor’s graph to highlight this visually:
As covered in my previous article on interest rates, discount rates for bonds include both a real and a risk premium rate. As measured by the New York Fed, the risk premium of government bonds (called the ATM term premium) was close to negative 0.50% at the end of January and shrank to closer to negative 0.30% (yes, this “premium” is more typically positive and why I still don’t like the risk/reward of longer-term interest rates).
Stocks also have a real rate and a risk premium. A small change in either rate can create a large change in prices. Nobel Laureate Robert Shiller showed that stock prices were much more volatile than dividends themselves, which implied that the risk premium used to discount those dividends must be very volatile. Later work, as surveyed in John Cochrane’s paper Macro-Finance, show that the risk component of the discount rate is puzzling high and investors are particularly risk-averse entering a recession (likely due to human biology).
Expected Return Models
For many years, the resulting quest of Modern Portfolio Theory was to better understand this risk premium. First and foremost, investors shouldn’t expect to be compensated for taking on risk that can be diversified away, but they should hope to earn more from assets that add to the overall risk of their portfolio (explained here). This basic insight helped establish the concept of the efficient frontier, which eventually lead to the CAPM. If this was all there was, investors would just own a simple passive market fund (whatever that means!).
As readers of this blog are no doubt aware, academics soon “discovered” that expected returns could also vary depending on how relatively cheap (even when employing very blunt measurements of value), how small, and how much momentum assets exhibited. A cursory search of “Smart Beta” ETFs will show even more options to potentially earn more than a simple passive market, but Value and Momentum seem to be universally accepted as the top two.
Predictive Models
Although there is more consensus on models that help explain performance across stocks, there is much less universal acceptance of models that can predict changes in expected returns (i.e., the discount rates). Valeriy Zakamulin does a nice job summarizing some of them in his recent post on this blog, including the Shiller CAPE model, which uses a long-run, inflation-adjusted average earning base, the Fed Model which incorporates relative value for dividend yields vs bond yields, and the Graham Model, which instead looks at earnings yields vs. bond yields. John Cochrane also reviews the theoretical justification for simply using dividend yields as a proxy in his 1999 article, Portfolio Advice for a Mulitfactor World. And lastly, let’s not forget about Wes’s deep dive into expected return forecasting.
All of the authors above would likely agree that although many models show strong correlations between historical predicted returns and realized longer-run expected returns, these same authors would also say that their models do a pretty poor job forecasting future returns with any degree of certainty. Remember, these are only models so by their nature have serious limitations.
The crux of the problem, though, stems from the shared assumption that P/E ratios, Dividend Yields, or some other souped-up measure of value, will revert to a normal level…but nobody knows what normal is! We only know what normal was. Cliff Asness and his colleagues cover this problem and focus on the Shiller’s CAPE ratio.
A chart below helps explain this reality:
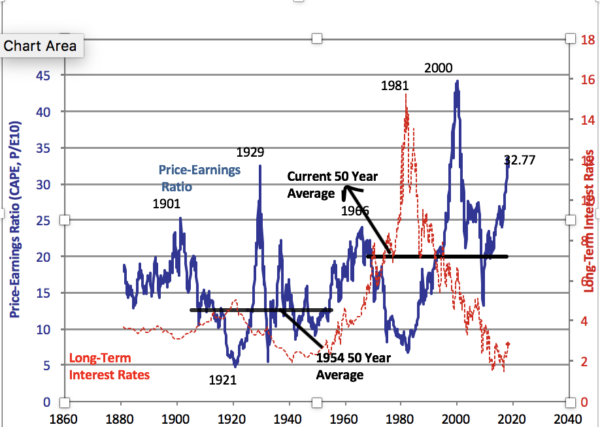
If an investor had calculated the CAPE ratio in 1954, she’d believe the norm to be 12.6x and had she reacted to the run-up in prices in the late 50s, she would have missed the bull market of the 1960s. Since 1968, the long-term average has been closer to 20, and at ~33x as of this writing, we appear to be well above fair value. But the current CAPE only uses earnings through the 3rd quarter of last year and includes the largest crash in earnings since the great depression. On a projected earnings basis, the P/E ratio looks much more modest.
To borrow another one of Cochrane’s graphs, the valuation doesn’t seem so off relative to dividends yields, especially when assuming the drop in real yields over the last few decades.

Implications for Investors
Investors demand a higher expected return when they see higher risks on the horizon. But prices may not drop because projected growth rates could be climbing at the same time. So which aspect of asset pricing fundamentals is causing the latest market gyrations? Fluctuating discount rates? Or changes in growth estimates?
Evidence points to changes in the discount rate. As Cochrane argues in his preface to the chapter, Return Forecasting and Time Varying Risk Premiums, in the book, The Fama Portfolio, even without the ability to distinguish between changes in growth estimates and discount rates, we can observe, as in fact Shiller did, that valuation measures like price/dividend ratios change independently of dividend growth. In other words, since ratios like dividend yields can’t explain dividend growth, variations in risk premium is all that is left.
Note that Cochran’s earlier piece rightfully downplaying market timing was published in 1999, at the height of steaming market-wide valuations (but especially within technology stocks, but more on that later). At the least, investors should have determined expected returns in the future were likely historically low, especially within technology stocks. A similar common sense approach to value may have avoided investments in the Florida condo market in 2006. Yes, asset pricing models are notoriously poor as tools to time the market, but that doesn’t imply investors should ignore valuations.
Asness et al, for instance, makes a credible case to “sin a little” when it comes to market timing. Their work shows that although investors would have added little to performance since the 1950s using a hindsight free CAPE model, combined with trend analysis and extending their method to bonds would have produced modest but real benefits.
All Sounds Great, but What Are the Practical Implications?
The discussion above attempted to bring any discussion of market movements back to the basics. In the end, there are two reasons for asset price movements: 1) changes in discount rates or 2) changes in expected growth rates. A few lessons to take from the discussion:
- Stay Calm: When prices go down because discount rates are changing, future expected returns are often simultaneously going up. You’ll thus likely be in the same spot in the long-run.
- Don’t be Blind to Valuations: Recognize that many valuation metrics (dividend yields, CAPE P/E Ratios and bond yields) aren’t likely to save us from market swoons, but they do warn us that expected returns going forward may be lower.
- Avoid Both Dramatic Action and Paralyzation: Although we can’t time the market, we can adjust our allocations and diversify our risk other ways, especially when we can do so in tax-advantaged accounts. One way to diversify is to take on additional risk within an asset, like adding to momentum and value exposure. Although the S&P500 dropped 37% from 2000 to 2002, the Vanguard Small Cap Value Fund increased 19%. Likewise, if an investor had the liquidity to rebuild her position after crashes like 2008, she should…sometimes. Investors should always weigh the value of their own human capital (e.g., job) when looking at diversity and recognize that growth, and thus prices, don’t always revert. Just ask a Japanese investor from 1989.
- Focus on What You Can Control: Along with diversification, this means avoiding unnecessary taxes. If you are going to adjust your portfolio, do so in your tax deferred accounts to avoid taxable gains. In market dips, look for opportunities to harvest capital losses.
As always, the best way to increase your wealth is to save more and pay less in fees. And the easiest way to let markets work on your behalf is to “do nothing.“
References[+]
| ↑1 | See Philosophical Economics piece |
|---|
About the Author: Jonathan Seed
—
Important Disclosures
For informational and educational purposes only and should not be construed as specific investment, accounting, legal, or tax advice. Certain information is deemed to be reliable, but its accuracy and completeness cannot be guaranteed. Third party information may become outdated or otherwise superseded without notice. Neither the Securities and Exchange Commission (SEC) nor any other federal or state agency has approved, determined the accuracy, or confirmed the adequacy of this article.
The views and opinions expressed herein are those of the author and do not necessarily reflect the views of Alpha Architect, its affiliates or its employees. Our full disclosures are available here. Definitions of common statistics used in our analysis are available here (towards the bottom).
Join thousands of other readers and subscribe to our blog.