What causes a stock’s price to move?
A great question, and one that puzzles most market observers every day. Since this is puzzling, it is an entertaining topic to discuss–enter CNBC and the financial media. In the short-run, stocks prices can move for a variety of reasons … noise trading, announcements from the FED, and 6 A.M. tweets from the President :).
Kidding aside, short-run moves in stock prices can be difficult to explain.
Some have also suggested that ETFs are now causing movements in stock prices. We have discussed a few papers that examine this topic, here and here.
While ETFs may have an impact, in the long-run one would generally expect that stocks move either up or down due to firm fundamentals, such as earnings.(1)
But the research on this topic tends to find that year-over-year Earnings Changes (by itself), has little explanatory power for predicting stock returns. In fact, if anything, studies have shown that earnings’ prediction power has decreased over time!
A working paper that discusses this topic is titled, “The Power of Firm Fundamentals in Explaining Stock Returns,” by Shao, Stoumbos, and Zhang. A link to the paper can be found here.
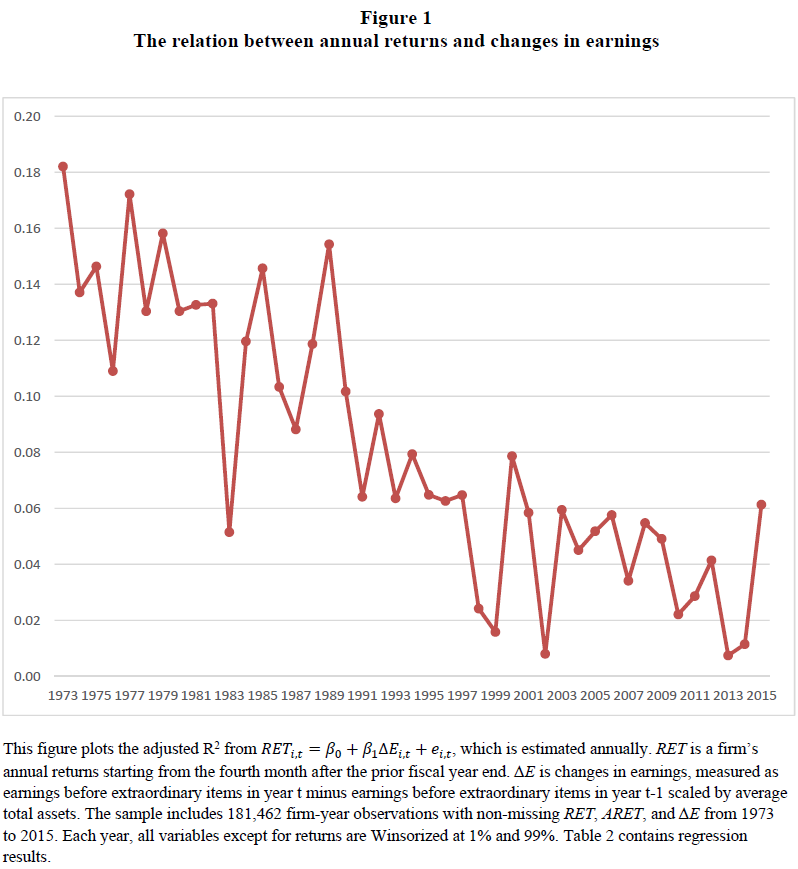
To highlight that the earnings prediction power has decreased over time, Figure 1 of the paper (shown below) graphs the  from a regression of changes in the firm’s earnings against the firm’s annual stock returns.
The equation is given here:

As is shown in the image, it appears that earnings are explaining less of the returns than in the past!(2)
The results are hypothetical results and are NOT an indicator of future results and do NOT represent returns that any investor actually attained. Indexes are unmanaged, do not reflect management or trading fees, and one cannot invest directly in an index.
Do Earnings Changes Explain Less About a Firm’s Stock Returns?
An alternative methodology, proposed by the authors and found in the IPO literature, is to use earning’s announcement returns to better measure “fundamental” information.
The paper explains the reasoning in the paper:
Intuitively, earnings announcement returns provide a better summary measure for three reasons. First, announcement returns capture the market’s surprise with much less measurement error than earnings changes and analyst forecast errors do. Second, announcement returns contain different types of fundamental news—both financial and nonfinancial news, and both current and future fundamental news. Finally, the relationship between annual returns and earnings announcement returns should be more homogeneous across firms than the relationship between annual returns and earnings surprises. Such homogeneity is necessary to accurately measure the explanatory power of firm fundamentals in a linear regression framework.
Given the author’s reasons, they go on to test how well earning’s announcement returns predict stock returns (again examining  ).
).
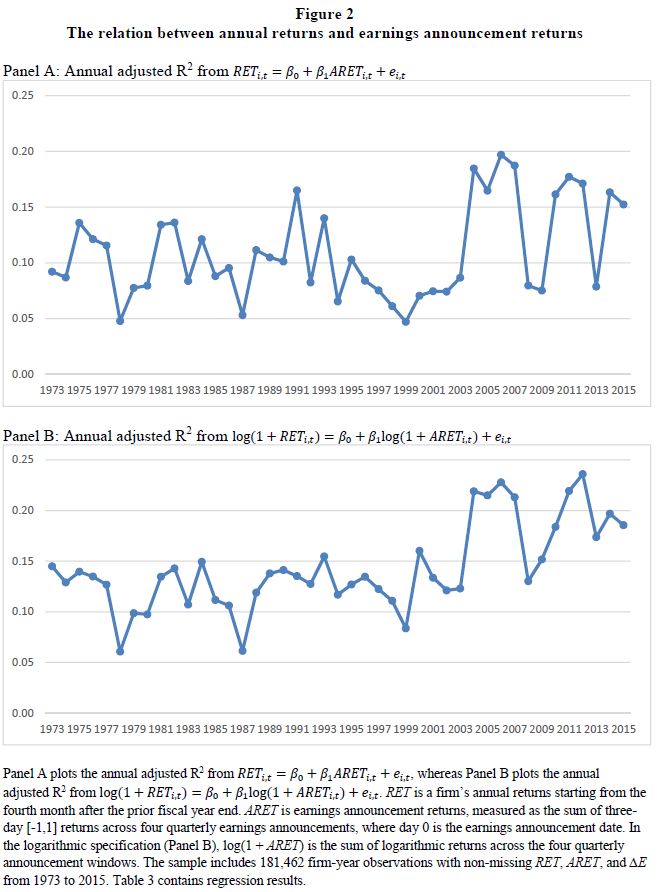
The results of regressing earnings announcement returns against stock returns are shown below:
The results are hypothetical results and are NOT an indicator of future results and do NOT represent returns that any investor actually attained. Indexes are unmanaged, do not reflect management or trading fees, and one cannot invest directly in an index.
As can be seen, when measuring the across time,(3) if anything, the amount of a stock’s return explained by earnings announcement returns has increased across time.
The authors note that post-2003, the average was around 20%, while before 2003 the average was around 10%.
But why would this increase occur? And why is 2003 an important date? The authors note that important rules under Sarbanes Oxley (SOX) and Global Settlement were put into place around 2003. The SOX legislation increased the credibility of the earnings data that was produced by the company after the legislation. In Table 3 (Panel C) of the paper, the authors add a “Post-2003” indicator variable to their regression of stock returns on earnings announcement returns and find a highly significant loading on the post-2003 indicator, indicating that had increased by around 7% post-2003.
The authors also test more detailed analysis to test this 2004-theory, as outlined in the paper:
Since becoming effective in 2004, SOX 404 has required managers and auditors to attest that a firm’s internal controls over financial reporting are effective. This might have increased the credibility of financial results, which in turn would have increased investor reliance on these results. We test the impact of SOX 404 with a difference-in-differences, with our control group consisting of firms that did not have to adopt SOX 404. While we find that R^2’s increased in 2004 for non-adopters, they increased even more for adopters. Thus SOX 404 seems to be partly responsible for the overall increase in explanatory power.
In addition, the paper examines the effect that Global Settlement rules may have had on analyst revisions/recommendations. The logic is the following:
We expect that the Global Settlement may have increased the information contained in analyst forecast revisions. There is evidence that analyst forecasts and recommendations were biased by investment banking relationships prior to the Global Settlement (Lin and McNichols, 1998), so if the rules effectively remove the influence of investment bankers, then analyst reports should have greater credibility, which in turn increases their informativeness.
The paper tests by running the following regression:

Since analyst days occur randomly throughout the year, the paper attempts to make sure they are not picking up “noise” in the regressions. If the analyst revisions/recommendations have no impact in explaining returns, the from the regression should be similar to the proportion of all days that analyst revisions/recommendations occur. The authors plot this percentage, called “ratio_info_days” in Figure 5 as well.(4)
Panel A of Figure 5 is shown below:

The results are hypothetical results and are NOT an indicator of future results and do NOT represent returns that any investor actually attained. Indexes are unmanaged, do not reflect management or trading fees, and one cannot invest directly in an index.
As is shown above, the when regressing stock returns against analyst revision/recommendation announcement returns has increased over time (and post 2003).
Similarly, the paper runs a regression of returns around 8-K filings.
The reason is given below:
The second regulatory change we examine is SOX Section 409, which called for an expansion in 8-K disclosures. The SEC implemented this expansion in August of 2004. This regulation added new events that needed to be disclosed with an 8-K filing, and it shortened the filing deadline to four business days after an event. The additional disclosure items may have increased the amount of information in the 8-K, and the shortened filing deadline may have decreased preemption of the information by news and leaks.
The results are in Panel B of Figure 5 and are similar to the graph above–indicating that regulatory changes may have increased the information embedded in 8-K filings.
So what we have seen above is that fundamental information does appear to have information after-all, when measured using announcement returns.
To formalize this idea that fundamental information matters, the paper regresses announcement returns for “all” events that should contain fundamental information. Specifically, the paper considers the 3-day announcement returns for “earnings announcements, analyst forecast revisions, analyst recommendations, and 8-K filings”. The results are shown in Table 9 of the paper, as well as Figure 7 which is shown below:
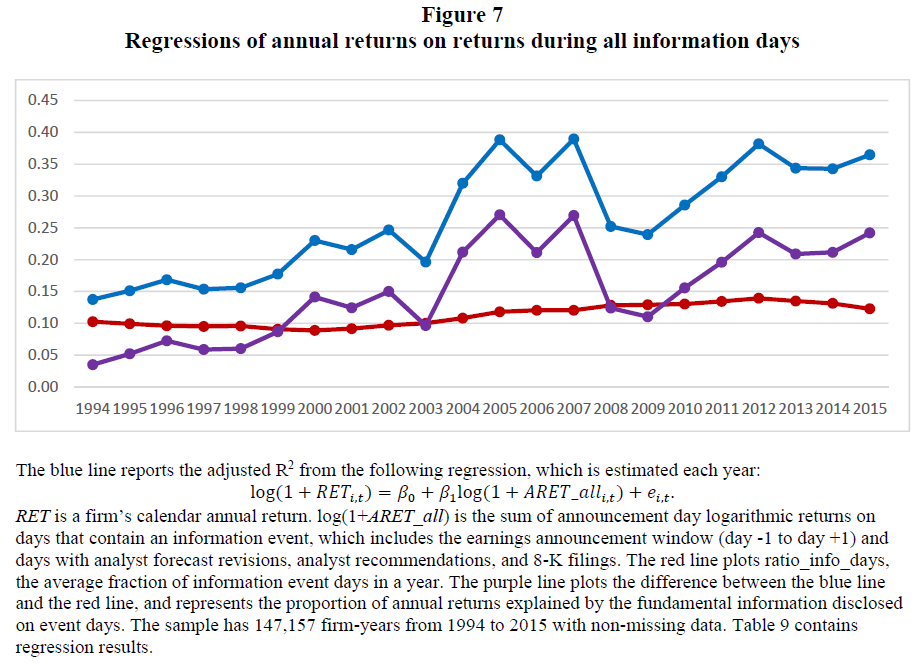
The results are hypothetical results and are NOT an indicator of future results and do NOT represent returns that any investor actually attained. Indexes are unmanaged, do not reflect management or trading fees, and one cannot invest directly in an index.
As can be seen above, relative to the null hypothesis that fundamental information does not matter (the red line),(5) announcement returns around fundamental informational events(6) picks up additional information within stock returns.
Thus, it appears that fundamental information matters to stock returns!
Conclusion:
This paper is informative in two ways.
First, the paper highlights that small changes in methodology can yield wildly different results. For example, when regressing stock returns against changes in earnings (as well as sales, gross profits, and operating income in Figure 8), it appears that fundamental information now has less explanatory power for stock returns! Alternatively, using announcement returns gives the exact opposite result! So which method is correct? Using announcement returns picks up additional information than the simple change in earnings, such as expectations and discount rates that investors apply to stocks. Thus, while both are valid methods, using announcement returns certainly is a good method to use to test the idea.
The second point that the paper makes, is one that most probably have always believed–that fundamental information (similar to characteristics) has an impact on stock returns. Thus, using a new method has simply reinforced our priors (which may or may not necessarily be good!).
Let us know what you think …
The Power of Firm Fundamentals in Explaining Stock Returns
- Shuai Shao, Robert Stoumbos, and X. Frank Zhang
- A version of the paper can be found here.
- Want a summary of academic papers with alpha? Check out our Academic Research Recap Category.
Abstract:
Prior literature shows that earnings have come to explain less stock price movement over time, suggesting that firm fundamentals have become less important. In this paper, we replace earning with earnings announcement returns as a measure of fundamental news and find that earnings news has come to explain more price movement over time. In the years after 2004, earnings announcement returns explain roughly 20% of the annual return—twice as much as they did before, indicating that firm fundamentals have become more important, not less. This pattern occurs for other forms of fundamental news. Collectively, the returns around earnings announcements, analyst forecast revisions, analyst recommendations, and 8-K filings went from explaining 15% of annual returns in the 1990s to 35% in the 2010s. In exploring possible explanations for the increase in the explanatory power of fundamental news, we find evidence consistent with regulatory changes, such as Sarbanes-Oxley and the Global Settlement, collectively making disclosures more credible and informative. In contrast, neither preannouncement information leaks, sample composition changes, nor concurrent information events (e.g., management forecasts) explain the increase in explanatory power.
References[+]
| ↑1 | Assuming stock multiples or discount rates stay the same |
|---|---|
| ↑2 | As measured by R^2 |
| ↑3 | As a measure of how much of the stock returns is explained by the earnings announcement returns |
| ↑4 | This is true if one assumes that the logarithmic daily returns are i.i.d. random variables. |
| ↑5 | As measured by “ratio_info_days” |
| ↑6 | Earnings announcements, analyst forecast revisions, analyst recommendations, and 8-K filings |
About the Author: Jack Vogel, PhD
—
Important Disclosures
For informational and educational purposes only and should not be construed as specific investment, accounting, legal, or tax advice. Certain information is deemed to be reliable, but its accuracy and completeness cannot be guaranteed. Third party information may become outdated or otherwise superseded without notice. Neither the Securities and Exchange Commission (SEC) nor any other federal or state agency has approved, determined the accuracy, or confirmed the adequacy of this article.
The views and opinions expressed herein are those of the author and do not necessarily reflect the views of Alpha Architect, its affiliates or its employees. Our full disclosures are available here. Definitions of common statistics used in our analysis are available here (towards the bottom).
Join thousands of other readers and subscribe to our blog.