Borne in academia and raised by fund managers seeking to outperform, value style mutual funds and ETFs today hold close to $2 trillion(1). But with poor returns over the past decade, the question of whether “value is dead” has become a popular topic of conversation.(2) The search term “is value investing dead” generates over 23 million results in less than 0.38 seconds! For comparison, searching for “FAANG Stocks” generates just 570,000 results(3). Perhaps it’s because FAANG is a funny acronym for financial news anchors to utter? Maybe it is much easier to go with a well-documented investing style like value, which has a long lineage of success dating back to 1926,(4) and has launched many careers both within the classroom and on Wall Street?
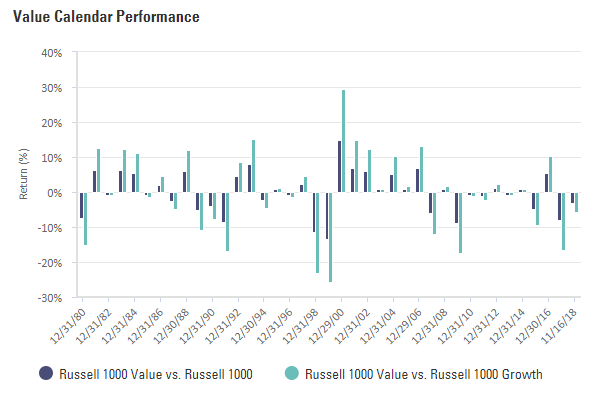
Fueling the debate, value, as measured by the Russell 1000 Value Index, unless specifically referenced otherwise, is underperforming the market again this year. If nothing changes, 2018 would mark the sixth year of underperformance in the last decade. This is notably different than value’s historical excess return relative to the broad market, which has essentially been a coin flip with value underperforming only 49% of the time over the last 39 calendar years(5). But let’s look beyond calendar-based returns to examine some trends and cyclical shifts to gain some insight into how value might possibly come back to life in 2019.
Source: Bloomberg Finance L.P., as of 11/15/2018.
Ten years later, where has value gone?
In spite of its recent track record, value is not dead, but the strategy has been wounded a few times since the financial crisis. In the early years of value’s lost decade, low long-term interest rates arguably helped lift growth stocks as their future cash flows became more valuable due to the lower discount rate. Bank stocks, the highest weighted value sector in the past 10 years (24%), also didn’t perform well as a result of the low rate era. At the same time, oil prices were highly volatile, falling 78% from peak to trough over the last ten years, hampering one of the larger sector weights in value (13%)(6).
Sector biases can play a role in broad-based value strategies over short-term horizons. For example, one of value’s four positive performing years in the past ten was 2016 when oil prices rallied by 85% and the market began to fully price in the Federal Reserve’s expected interest rate hikes.
Over the more recent three-year period, the flattening yield curve has weighed on value’s performance relative to the broader market—exuding an 88% correlation to the spread between the 10- and 2-year yield(7), an uptick over the average for the last 10 years. Lastly, being underweight high growth large-cap tech and consumer discretionary stocks was the straw that broke value’s back.
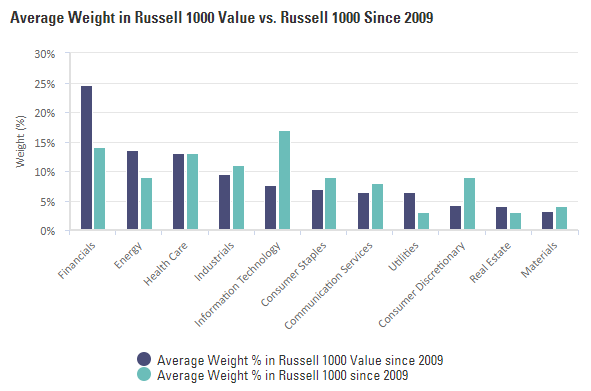
Source: Bloomberg Finance L.P., as of 11/15/2018 based on holdings of Russell 1000 Value and Russell 1000 Index from 04/2009 to 11/15/2018.
Determining the right “value”
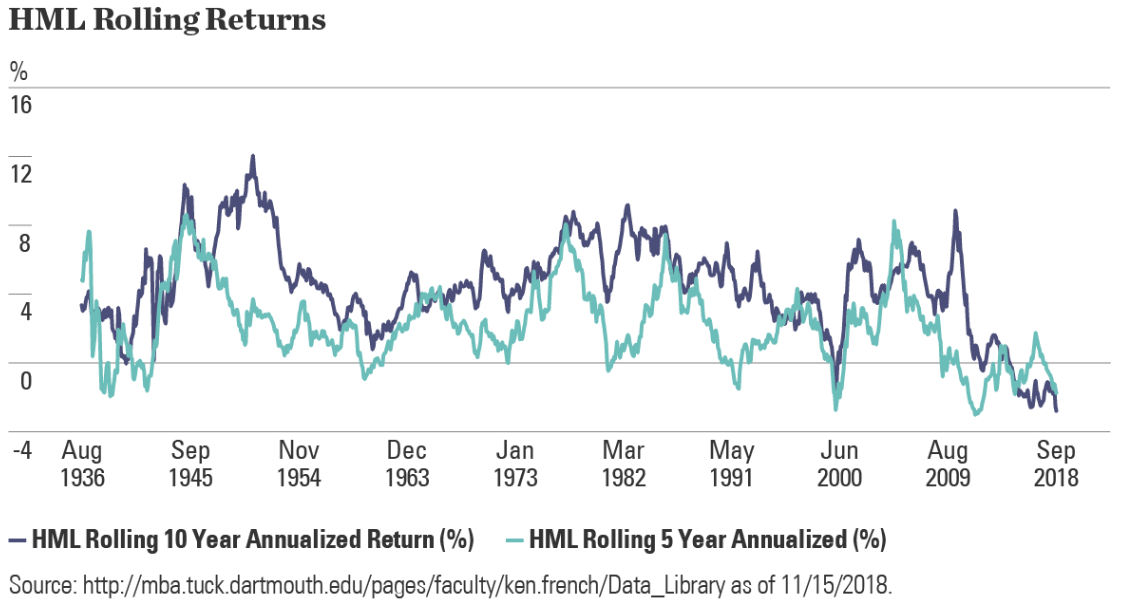
It’s constructive to explore different segments of value to understand the trends leading to value’s lost decade. The below chart displays the academic version of value, the Fama & French High-minus-Low (“HML”) factor(8), and its rolling 5- and 10-year annualized return over the better part of the last century. The most recent 5- and 10-year rolling return trends show that it’s been quite a tough time with just minor peaks above zero in 2014 and 2016 on the rolling 5-year time series. On a 10-year basis, HML hasn’t been positive since 2014.
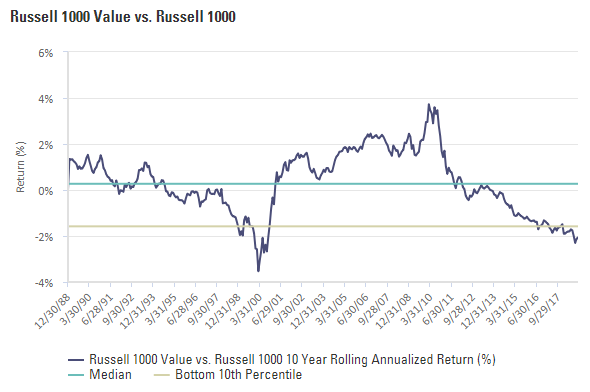
But HML is an academic, highly concentrated long-short value factor exposure. What about broad-based investable gauges of value? Unfortunately, we find the same result, as shown below using data back to the 1970s as represented by Russell 1000 indices. The rolling 10-year performance of Russell 1000 Value relative to the Russell 1000 Index has been below zero since the fall of 2013, now sitting in the bottom 10th percentile.
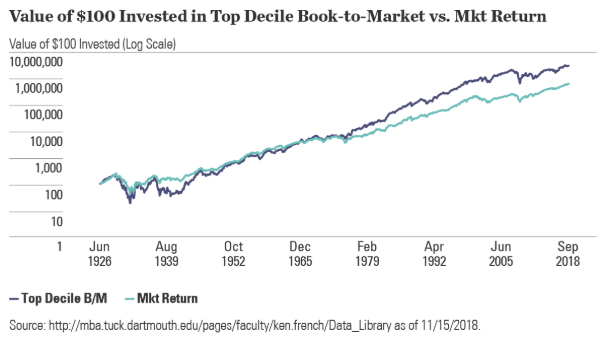
Source: Bloomberg Finance L.P., as of 11/15/2018.
The cuts have been deep and the shifts here show that there have been many protracted periods of underperformance, but the recent occurrence has been the deepest. Underperformance persists across many forms of value — large-cap, small-cap, US, and Global. The most concentrated factor exposure (top decile book-to-market portfolio from Fama & French(9)) fell the most versus the market (MKT) factor from Fama & French(10). The only value exposure modeled below with positive returns over any of the last one-, three-, five-, and ten-year period is the highly concentrated S&P 500 Pure Value exposure that weights based on stocks’ value characteristics, which had a positive 10-year outperformance versus the S&P 500. Given the period analyzed started in an idiosyncratic event (the Great Financial Crisis), this outlier is just that—an outlier. Even with that one up bar, it’s clear that value has had a rough 10 years.
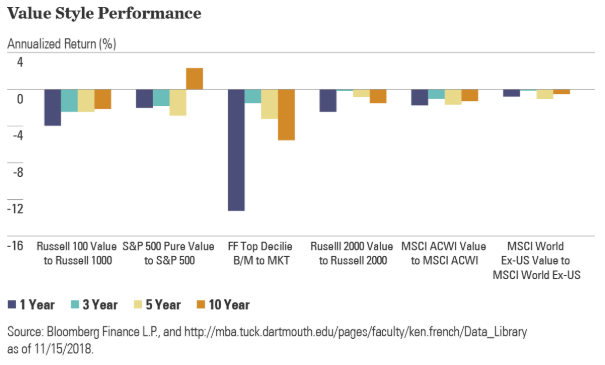
Regardless of market shifts, as other styles (e.g. momentum, size) can underperform based on market trends as well, the long-term evidence of the value premium is hard to argue with, given top decile book-to-market stocks 2% annualized excess return relative to the markets return since 1926. Despite the recent terrible performance, value has won inflows versus growth, amassing $70 billion in fund flows versus growth loss of $350 billion over the last 10 years(11).
Certain value strategies hold promise for 2019
Is value dead? The answer really depends on who you ask. I propose that we agree that the value factor is the Schrödinger’s cat(12) of investing styles: your view on the situation depends on your perspective? Value is both alive and dead, based on the lookback period. We base our “alive” view on comparing long-term versus short-term returns, and we base our “dead” view on the past 10 years of performance. Perhaps patience may soon be rewarded, as the most recent performance trends may offer some hope that certain value strategies may beat the market in 2019.
With 2019 on the horizon theses four trends smay favor certain value strategies:
- Valuations: Valuations on broad value relative to growth have shifted, as shown below in a quantitative z-scoring model of blended valuation characteristics for value (Russell 1000 Value) relative to growth (Russell 1000 Growth). The characteristics used are Price-to-Book, Price-to-Earnings, Price-to-Sales, Price-to-Free-Cash Flow, Price-to-Next-Twelve-Months-Earnings, and Enterprise value-to-EBITDA. As shown, the metric has spiked significantly and reached levels not seen since the dot-com bubble era, albeit still sitting well below those bubbly peaks. Valuations indicate value may offer some “value” in 2019, a view supported by the State Street Global Advisors Investment Solutions Group when assessing factor returns for global equities. Specifically, the team focuses on book/price spreads for each factor and relates that to the factor’s subsequent returns. Using these relationships, they forecast a 1-year return premium of 1.4% for the value-tilted portfolio, 1.3% for the quality-tilted portfolio, 1.1% for the minimum-variance portfolio and 1.8% for the equal-weighted portfolio over the broader global equity market(13).
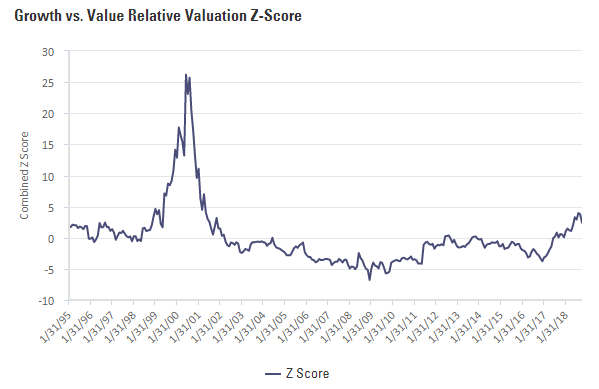
Source: Bloomberg Finance L.P., as of 11/15/2018.
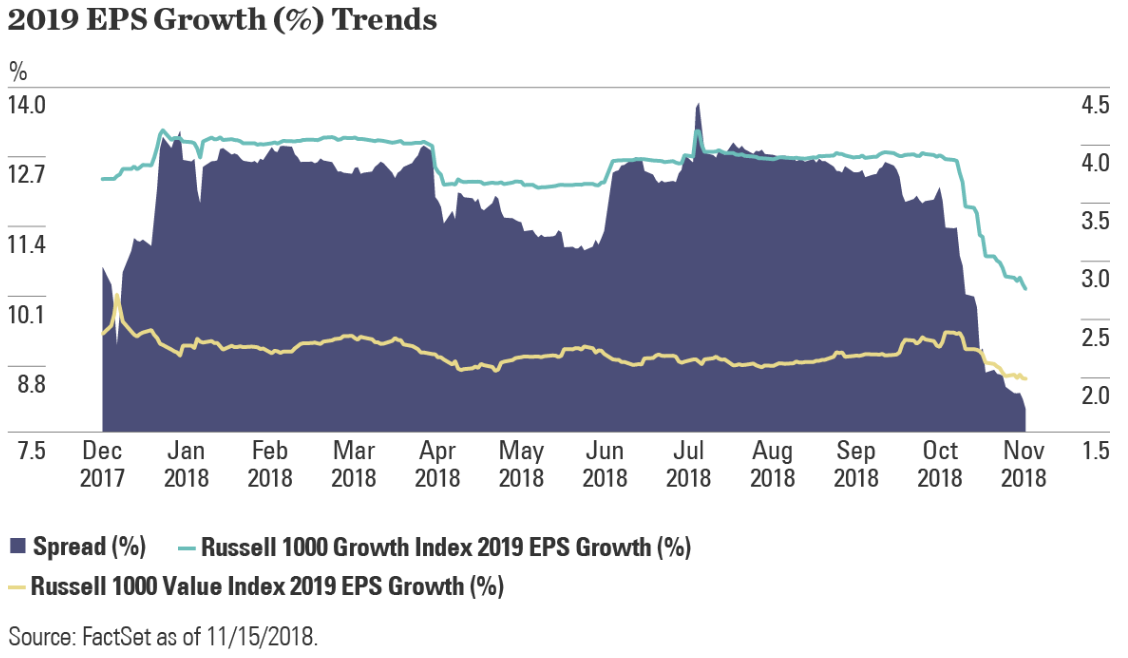
- Growth: Growth trends are also encouraging for value-oriented strategies and styles. As shown below, growth stocks have experienced a larger recent decline in 2019 consensus earnings-per-share (EPS) growth than value stocks. The spread between these two styles expected 2019 growth rates has narrowed to just 1.7%, the lowest point on the year and a 61% decline from peak to trough. And this trend is consistent with our view that we have gone past the peak of earnings growth and companies are revising their expectations lower as the boost from fiscal stimulus wanes, monetary policy continues tightening, and ongoing geopolitical tensions impact sentiment. Combine this with the lofty valuations for growth stocks and it’s no surprise that value has started to turn things around a bit.
- Momentum/Trend: As the fourth quarter kicked off, value only had four months of outperformance, and 92 days of market-beating returns, less than half of all trading days (223). The trend, lately, however, has been more positive with value outperforming the market on 61% and 67% of the days in October and November (thru November 19th)(14). There is still more room to maneuver as well, as the ratio of value to the market and value to growth had recently fallen below the 10th decile in its history, as shown below. The dotted lines show the trends in value compared to growth, while the solid lines depict value relative to the market (Russell 1000). Both are still below the 10th percentile but due to the positive days in October and November have recently reversed course. Combined with encouraging valuations and earnings expectations, this indicates some further mean reversion is likely ahead.
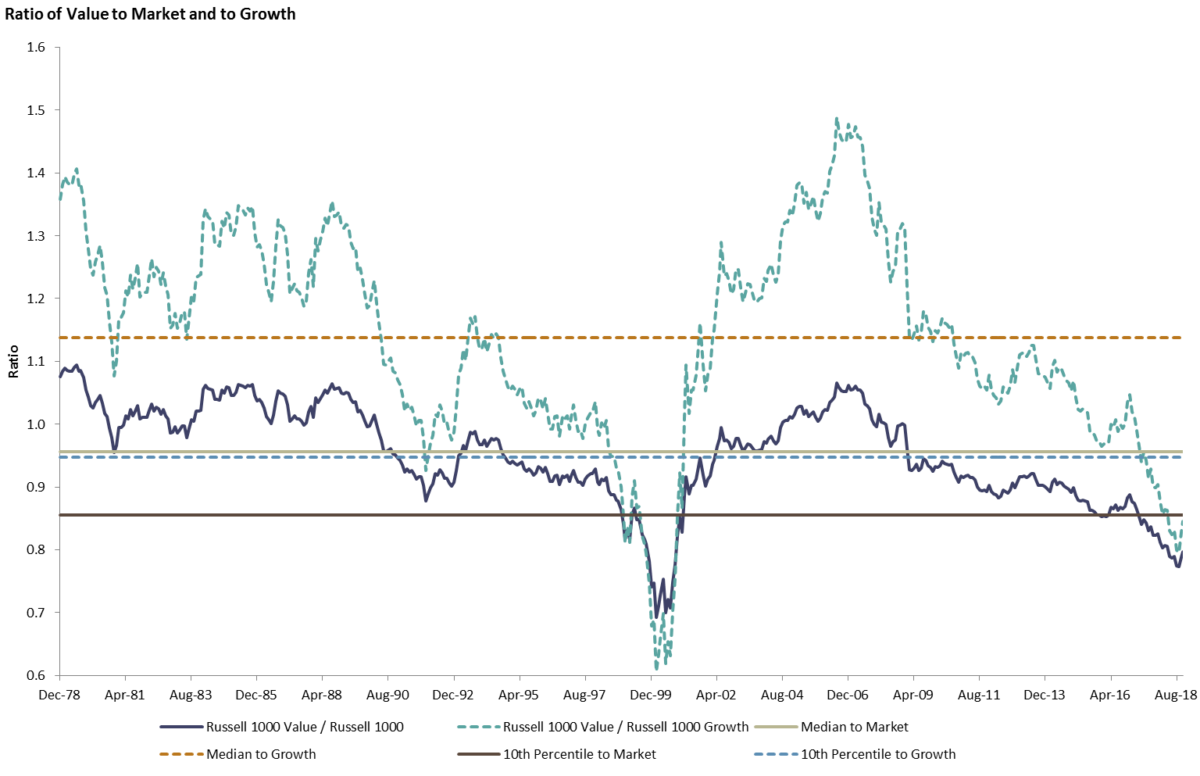
Source: Bloomberg Finance L.P., as of 11/15/2018.
- Quality: With the market selling off there has been a desire to seek out companies with healthy balance sheets, a phenomenon that powered value’s performance and may be a driver ahead. Decomposing factor spread returns on the Russell 1000 Value Index shows that value stocks with low earnings volatility (i.e., a quality growth characteristic) drove October’s returns significantly. As shown below, the earnings variability of quintile one minus quintile five—a factor spread which goes long companies with the highest earnings variability and short companies with lowest earnings variability—posted a return of -8.38% in October. This is a sign of the market favoring quality-centric firms, as a negative return means the short side (low variability) of the spread had higher returns than the long side (higher variability). There is further evidence of this when we see decomposing value returns by companies with high return on equity (ROE), another sign of quality. Value stocks with high ROE have outperformed low ROE stocks in 2018, and more so since August of this year when the market took on a more decidedly defensive tone. The same trend has occurred with free-cash-flow, another quality trait(15).
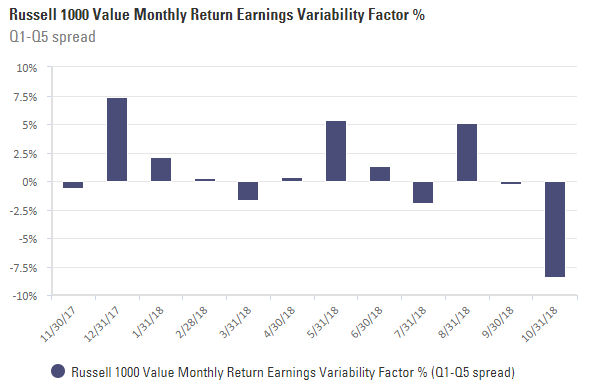
Source: Bloomberg Finance L.P., as of 11/15/2018.
Putting this all together in portfolios
The goal here was to show how the value factor has performed over different periods and how recent history may inform what specific market environments mean for value investing.
Value is not dead. Cyclical shifts happen and the premia has almost 100 years of quantifiable data to support its thesis. Based upon trends in valuations, earnings growth and momentum, value may outperform the market and growth stocks in 2019. However, due to the current length of the cycle and the pervasive headline risk present in the market from ongoing political schadenfreude and the Federal Reserve’s rate hikes likely making the yield curve flatter or inverted in 2019, it may be more beneficial to look beyond value to focus on quality growth at a reasonable price.
Favoring more quality-defensive type exposures with a defined value bias may be beneficial in 2019, as it has been over the past two months. Given concerns over growth’s lofty valuations, it may be wise not to pay high multiples for next year’s earnings if we are at peak earnings growth. And now value stocks are expected to grow their bottom line at a closer rate in 2019, but at more reasonable valuations.
Warren Buffett, one of the legendary value investors once proclaimed:
Long ago, Ben Graham taught me that ‘Price is what you pay; value is what you get.’ Whether we’re talking about socks or stocks, I like buying quality merchandise when it is marked down.”
With all the trends mentioned above, it’s shaping up to be a Buffet type of market in 2019.
For regular insights from Matthew check out his posts on the SPDR® Blog.(16)
References[+]
| ↑1 | Morningstar |
|---|---|
| ↑2 | See here for a discussion on this blog. |
| ↑3 | Google, 11/15/2018. |
| ↑4 | Fama and French, 1993, “Common Risk Factors in the Returns on Stocks and Bonds,” Journal of Financial Economics, for a complete description of the factor returns. |
| ↑5 | Bloomberg Finance L.P., as of 11/15/2018. |
| ↑6 | Bloomberg Finance L.P. as of 11/15/2018 |
| ↑7 | Bloomberg Finance L.P., as of 11/15/2018 based on the Russell 1000 Value Index ratio of performance vs. Russell 1000 Index and the US 10-Year Yield–US 2-Year Yield. |
| ↑8 | HML (High Minus Low) is the average return on the two value portfolios minus the average return on the two growth portfolios. HML = 1/2 (Small Value + Big Value) – 1/2 (Small Growth + Big Growth). |
| ↑9 | http://mba.tuck.dartmouth.edu/pages/faculty/ken.french/Data_Library/det_form_btm.html |
| ↑10 | Return on the market, value-weight return of all CRSP firms incorporated in the US and listed on the NYSE, AMEX, or NASDAQ that have a CRSP share code of 10 or 11 at the beginning of month t, good shares and price data at the beginning of t. |
| ↑11 | Morningstar, as of 11/15/2018. |
| ↑12 | Schrödinger’s cat: a cat, a flask of poison, and a radioactive source are placed in a sealed box. If an internal monitor (e.g. Geiger counter) detects radioactivity (i.e. a single atom decaying), the flask is shattered, releasing the poison, which kills the cat. The Copenhagen interpretation of quantum mechanics implies that after a while, the cat is simultaneously alive and dead. |
| ↑13 | As of 09/30/2018. The forecasted returns are annual arithmetic averages based on SSGA’s Investment Solutions Group September 30, 2018 forecasted returns and long-term standard deviations. The forecasted performance data is reported on a gross of fees basis. Additional fees, such as the advisory fee, would reduce the return. For example, if an annualized gross return of 10% was achieved over a 5-year period and a management fee of 1% per year was charged and deducted annually, then the resulting return would be reduced from 61% to 53%. The performance includes the reinvestment of dividends and other corporate earnings and is calculated in the local (or regional) currency presented. It does not take into consideration currency effects. The forecasted performance is not necessarily indicative of future performance, which could differ substantially. |
| ↑14 | Bloomberg Finance L.P., as of 11/19/2018. |
| ↑15 | FactSet, as of 10/31/2018. |
| ↑16 |
Definitions Earnings Per Share (EPS) Earnings Before Interest, Taxes, Depreciation and Amortization (EBITDA) NTM Price to Earnings Ratio (NTM P/E) Price to Book Ratio (P/B) Price to Earnings Ratio (P/E) Price to Sales Ratio (P/S) Russell 1000® Index Russell 1000 Growth Index Russell 1000 Value Index S&P 500 Index S&P 500 Pure Value Index |
About the Author: Matthew Bartolini
—
Important Disclosures
For informational and educational purposes only and should not be construed as specific investment, accounting, legal, or tax advice. Certain information is deemed to be reliable, but its accuracy and completeness cannot be guaranteed. Third party information may become outdated or otherwise superseded without notice. Neither the Securities and Exchange Commission (SEC) nor any other federal or state agency has approved, determined the accuracy, or confirmed the adequacy of this article.
The views and opinions expressed herein are those of the author and do not necessarily reflect the views of Alpha Architect, its affiliates or its employees. Our full disclosures are available here. Definitions of common statistics used in our analysis are available here (towards the bottom).
Join thousands of other readers and subscribe to our blog.