A physicist, a chemist, and an economist are stranded on an island, with nothing to eat. A can of soup washes ashore. The physicist says, “Let’s smash the can open with a rock”. The chemist says, “Let’s build a fire and heat the can first”. The economist says, “Let’s assume that we have a can-opener…”.
Despite economists being regularly featured as the butt of jokes as well as in less-humorous research that shows that their economic predictions have low predictive value, they are ubiquitous in the financial world. There is no escaping them when watching Bloomberg, CNBC, or other channels dedicated to financial markets.
Given the poor track record of economists, some investors prefer to avoid forecasts altogether and follow a data-driven approach. However, most economic data like GDP growth or the unemployment rate is either lagging or coincident in nature, which typically means it is already reflected in the market and therefore less useful.
Leading indicators might be more interesting as they, well, supposedly lead. One of the most commonly watched indicators is the Purchasing Manager’s Index (PMI), which describes the views on business conditions of purchasing managers from 400 companies of 19 primary industries. Purchasing managers are akin to capital allocators as they have to make investment decisions on how to allocate resources.
In this short research, we will investigate if there is a relationship between the PMI and the returns of common equity factors like Value or Momentum and if affirmative, can be used for allocation decisions.
70 YEARS OF PMI DATA
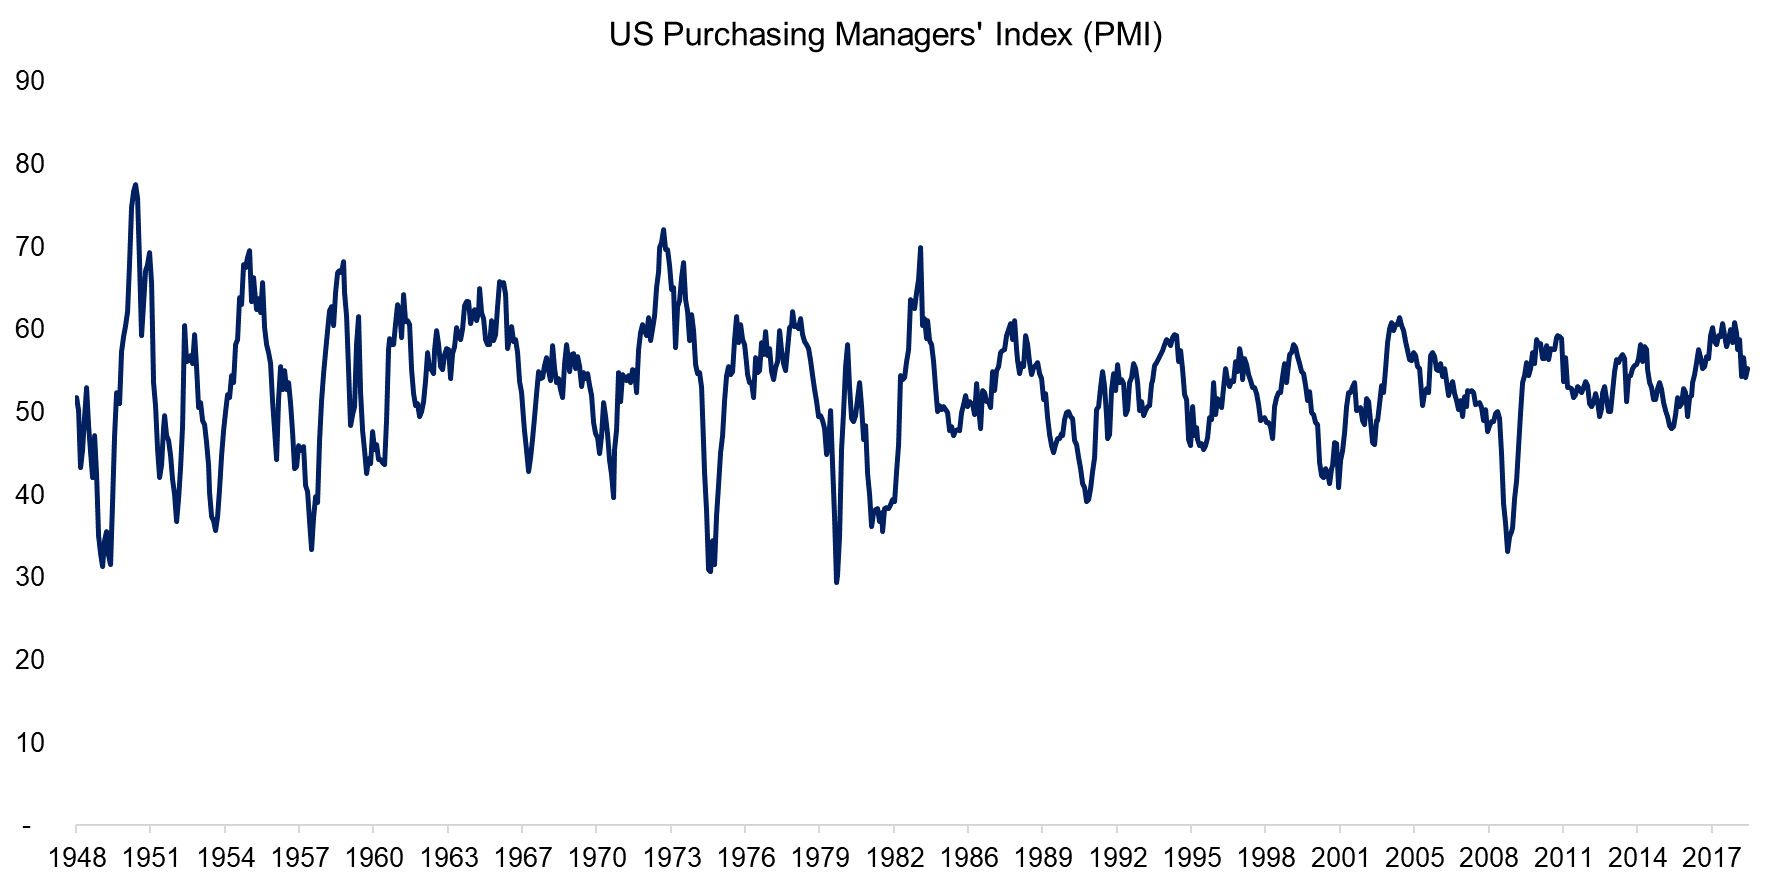
The Institute of Supply Management (ISM) began reporting the PMI in the US in 1948, which provides long-term data for analysis. A PMI reading of above 50 implies that business conditions are favorable and suggests that the economy is expanding, a PMI of 50 means no change, while below 50 implies a contraction.
The data for the last 70 years shows that economic volatility reduced structurally as the swings in the PMI have become less aggressive over time, at least in the perception of the surveyed purchasing managers. Perhaps this reflects that the US Fed has become better at managing the economy.
RELATIONSHIP BETWEEN EQUITY FACTORS & THE PMI
We analyze the relationship between the PMI, the S&P 500, and three common equity factors namely Value, Size, and Momentum. The factors represent long-short portfolios comprised of the top and bottom 10% of US stocks and data is sourced from Ken French’s website.
We observe that the S&P 500, Value and the Size factors benefitted from growth in the PMI, which implies an improvement in business and economic conditions. A negative PMI reading is correlated with lower returns for the S&P 500 and negative returns for the two factors.
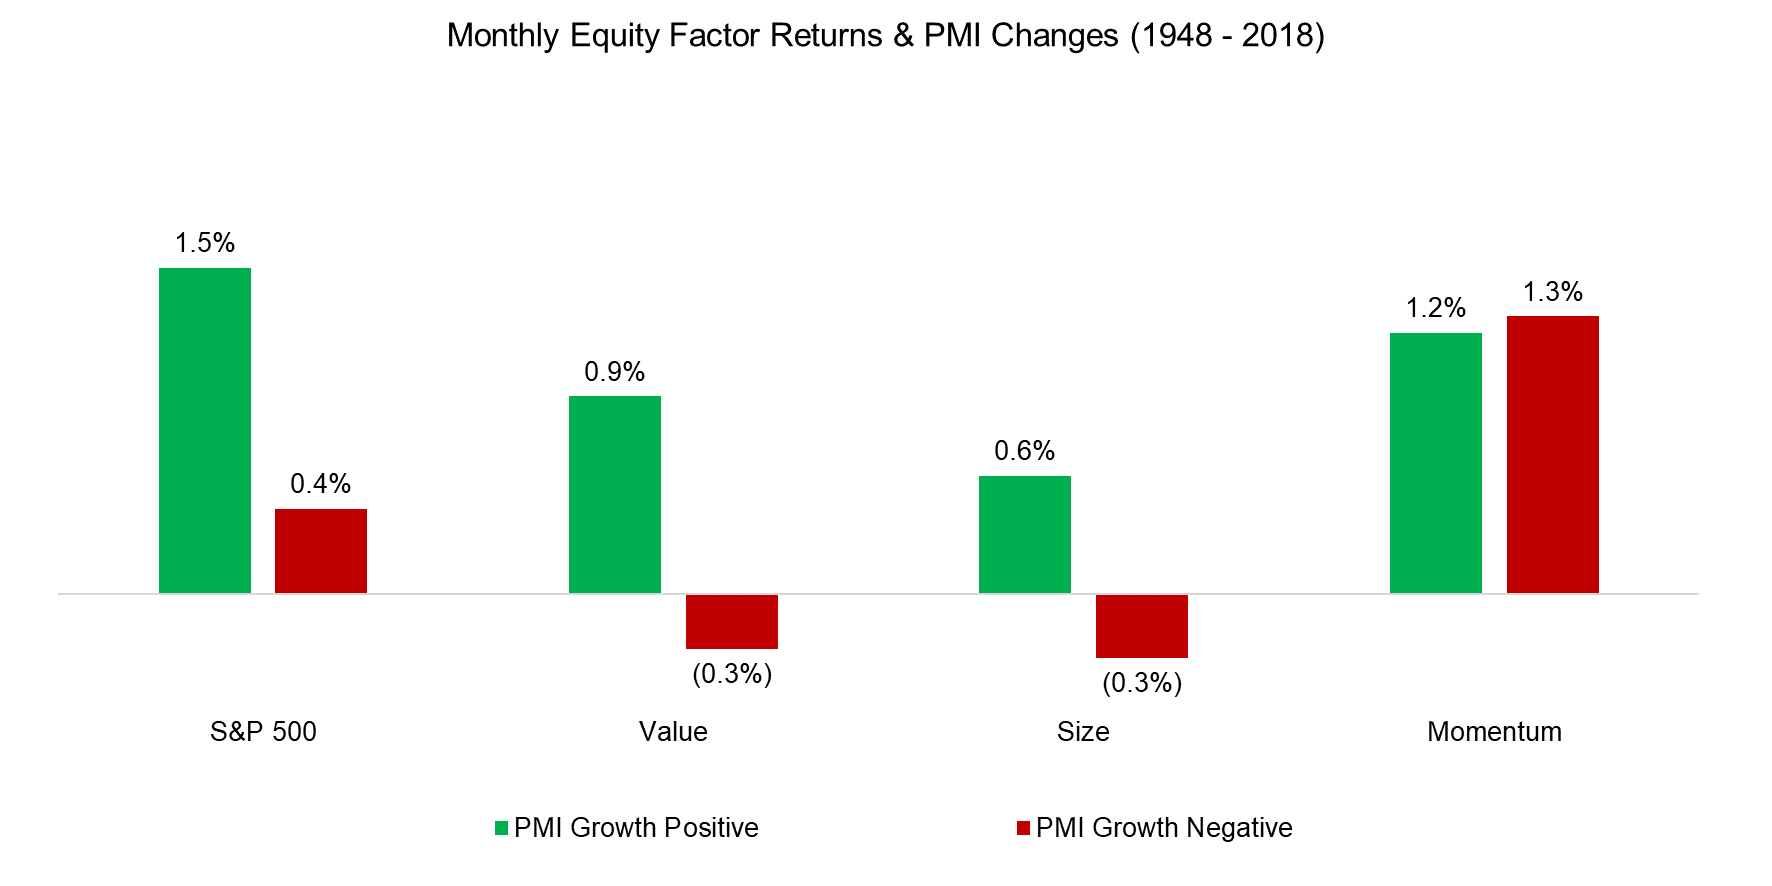
These results are somewhat intuitive. Value stocks represent companies with temporary or structural issues and smaller companies tend to be riskier than larger companies. Investors will likely only consider these kinds of stocks when the economic outlook is benign. The PMI can be interpreted as an indicator of risk sentiment.
Similarly, we published previously on using the historical skewness of the stock market to measure investor sentiment, which highlighted that almost all returns of the Value factor since 1926 occur when market skewness was positive (please see Improving the Odds of Value).
Effectively, these results suggest that the performance of the Value and Size factors is primarily driven by risk sentiment.
In contrast, there does not seem to be a relationship between the Momentum factor and the PMI as the monthly returns were almost identical at positive and negative PMI readings. When investors are buying winners and selling losers, then the economic outlook seems to play a less important role.
TACTICAL FACTOR ALLOCATIONS
Factors are as cyclical as equity markets and investors are continuously searching on how to harvest factor returns more efficiently. Investing tactically in factors might be considered factor timing, but we would change the perspective and view tactical allocations as a core feature of a sound risk management framework. The objective is not to achieve higher returns, but more consistency and reduced drawdowns.
Given that there was no relationship between the Momentum factor and the PMI, we will focus exclusively on Value and Size. Although we identified that growth in the PMI resulted in positive returns for these two factors, it does not imply that the PMI has any predictive powers for future returns.
In order to evaluate if the PMI readings can be used for tactical investment decisions, we create a simple allocation model based on the 12-month z-score of the PMI data. A z-score is ideal given the mean-reversionary characteristics of the PMI readings. We divide the 70 years into an in-sample and an out-of-sample period. We optimize the total return for the in-sample period from 1948 to 1983, which highlights that investors should not allocate to the Value factor if z-score is below -1. At that level, the purchasing managers would have a strongly negative outlook on business and economic conditions. Investors would not likely want to hold problematic or risky stocks in this kind of market environment.
Given that we optimized the results, we unsurprisingly observe that the risk-managed Value factor generated higher and more consistent returns with reduced drawdowns than the base case.
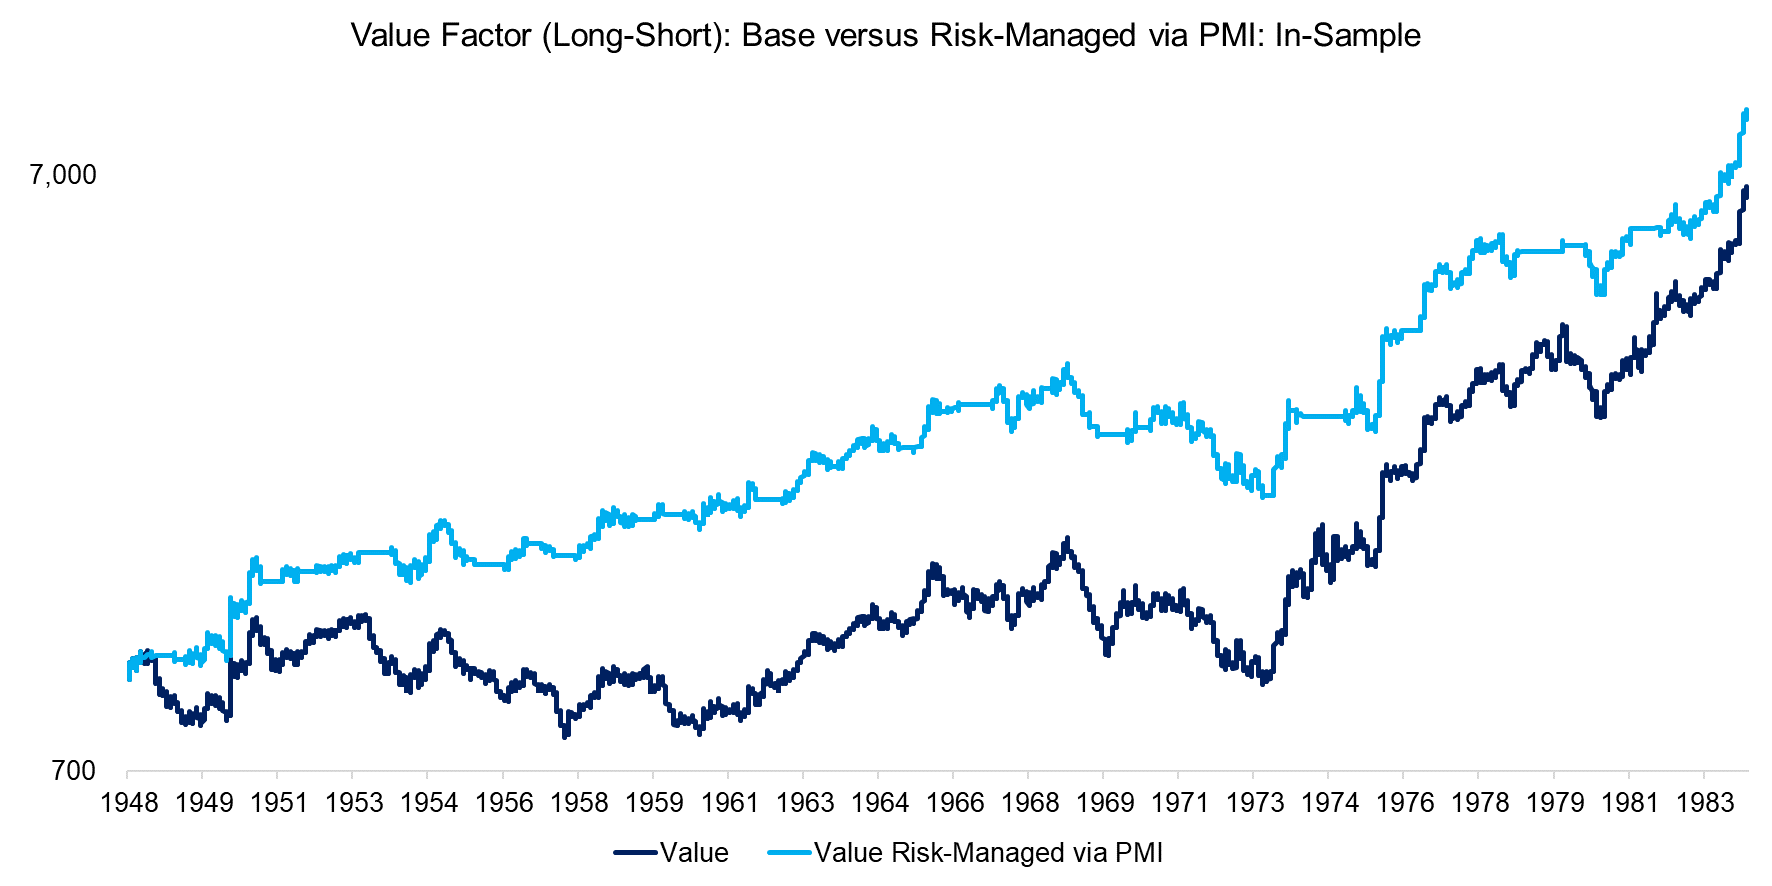
Source: FactorResearch. The results are hypothetical results and are NOT an indicator of future results and do NOT represent returns that any investor actually attained. Indexes are unmanaged, do not reflect management or trading fees, and one cannot invest directly in an index.
As typical in backtesting, the out-of-sample results for the period from 1983 to 2018 were far less attractive than the in-sample results. We observe that the risk-managed Value factor did generate higher returns than the base case, but that the outperformance is mainly attributed to the last decade.
However, it is worth noting that the risk-managed Value factor allocates tactically and is only invested approximately 70% of the time. Therefore we can add another scenario, where any available cash is reinvested into short-term bonds to earn interest, which results in a more favorable out-of-sample performance.
The analysis can be challenged that it lacks transaction costs when switching between factor and cash allocations. However, the tactical allocation model is deliberately designed to be slow-moving and only changes allocations approximately twice per year, which implies low transaction costs. Trading ETFs or funds has also become quite cheap and even free for some investors.
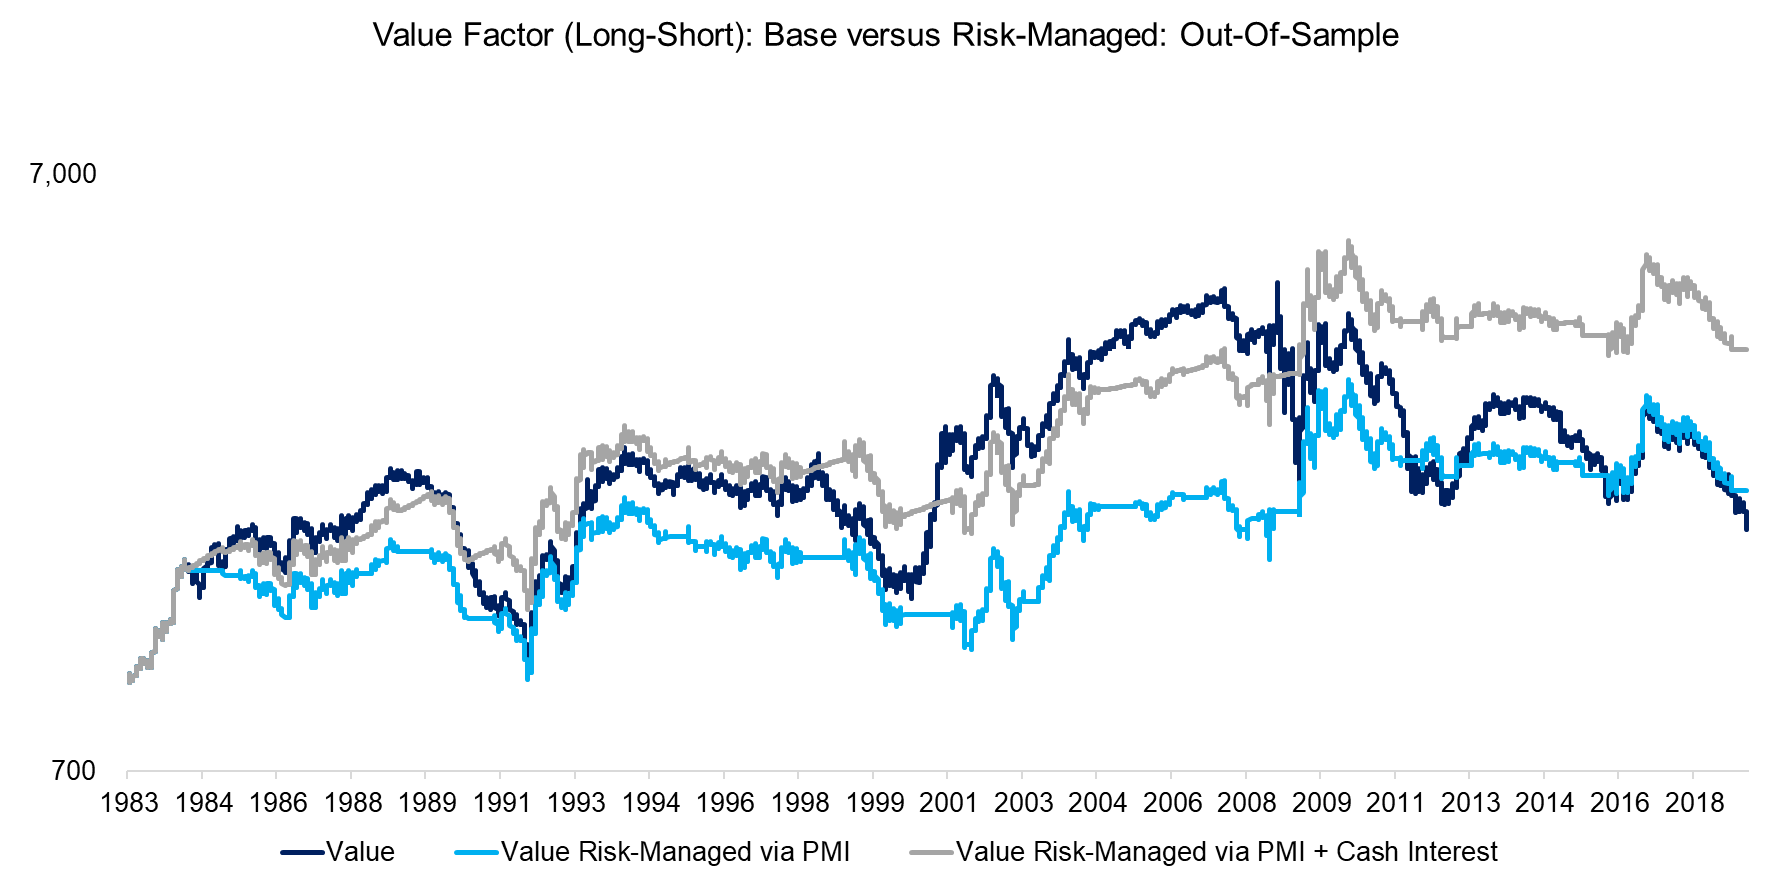
Source: FactorResearch. The results are hypothetical results and are NOT an indicator of future results and do NOT represent returns that any investor actually attained. Indexes are unmanaged, do not reflect management or trading fees, and one cannot invest directly in an index.
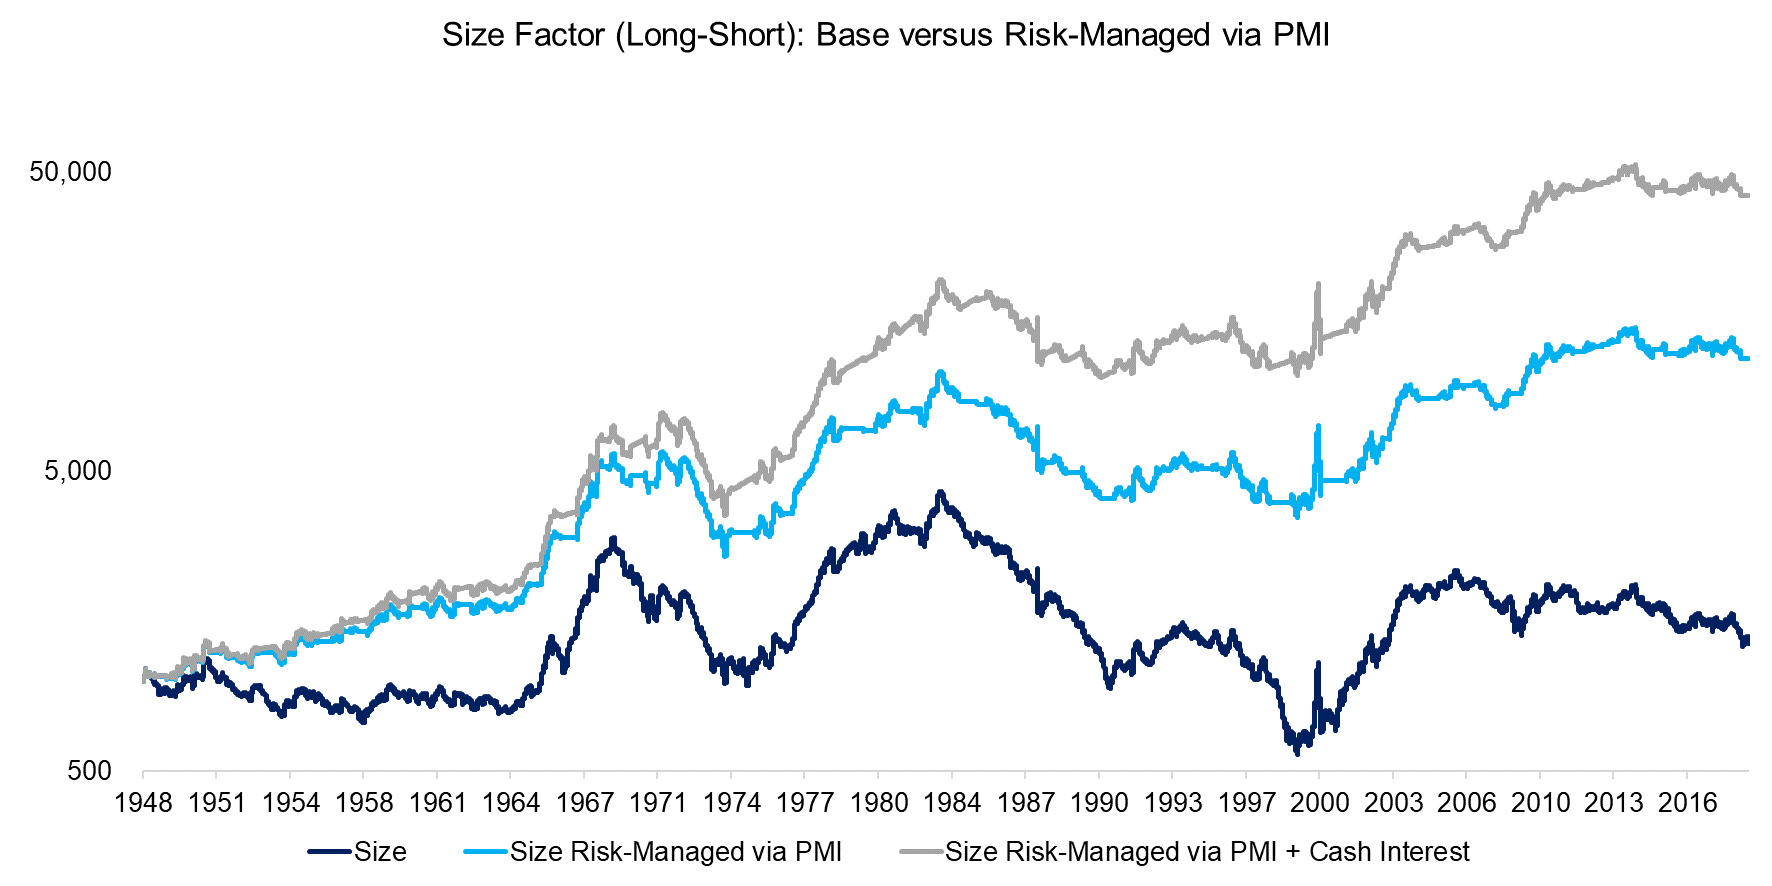
Finally, we can apply the same tactical allocation model to the Size factor, which represents a second out-of-sample test. Rolf W. Banz published his influential paper on positive excess returns of the Size factor in 1981, which in hindsight is the approximate peak in performance. Allocating to small caps has not been an attractive strategy since then as the total return was negative.
However, if investors would have allocated tactically to the Size factor when the PMI reading was not too negative as measured by the z-score, then the factor performance would have been much greater and more consistent.
Source: FactorResearch. The results are hypothetical results and are NOT an indicator of future results and do NOT represent returns that any investor actually attained. Indexes are unmanaged, do not reflect management or trading fees, and one cannot invest directly in an index.
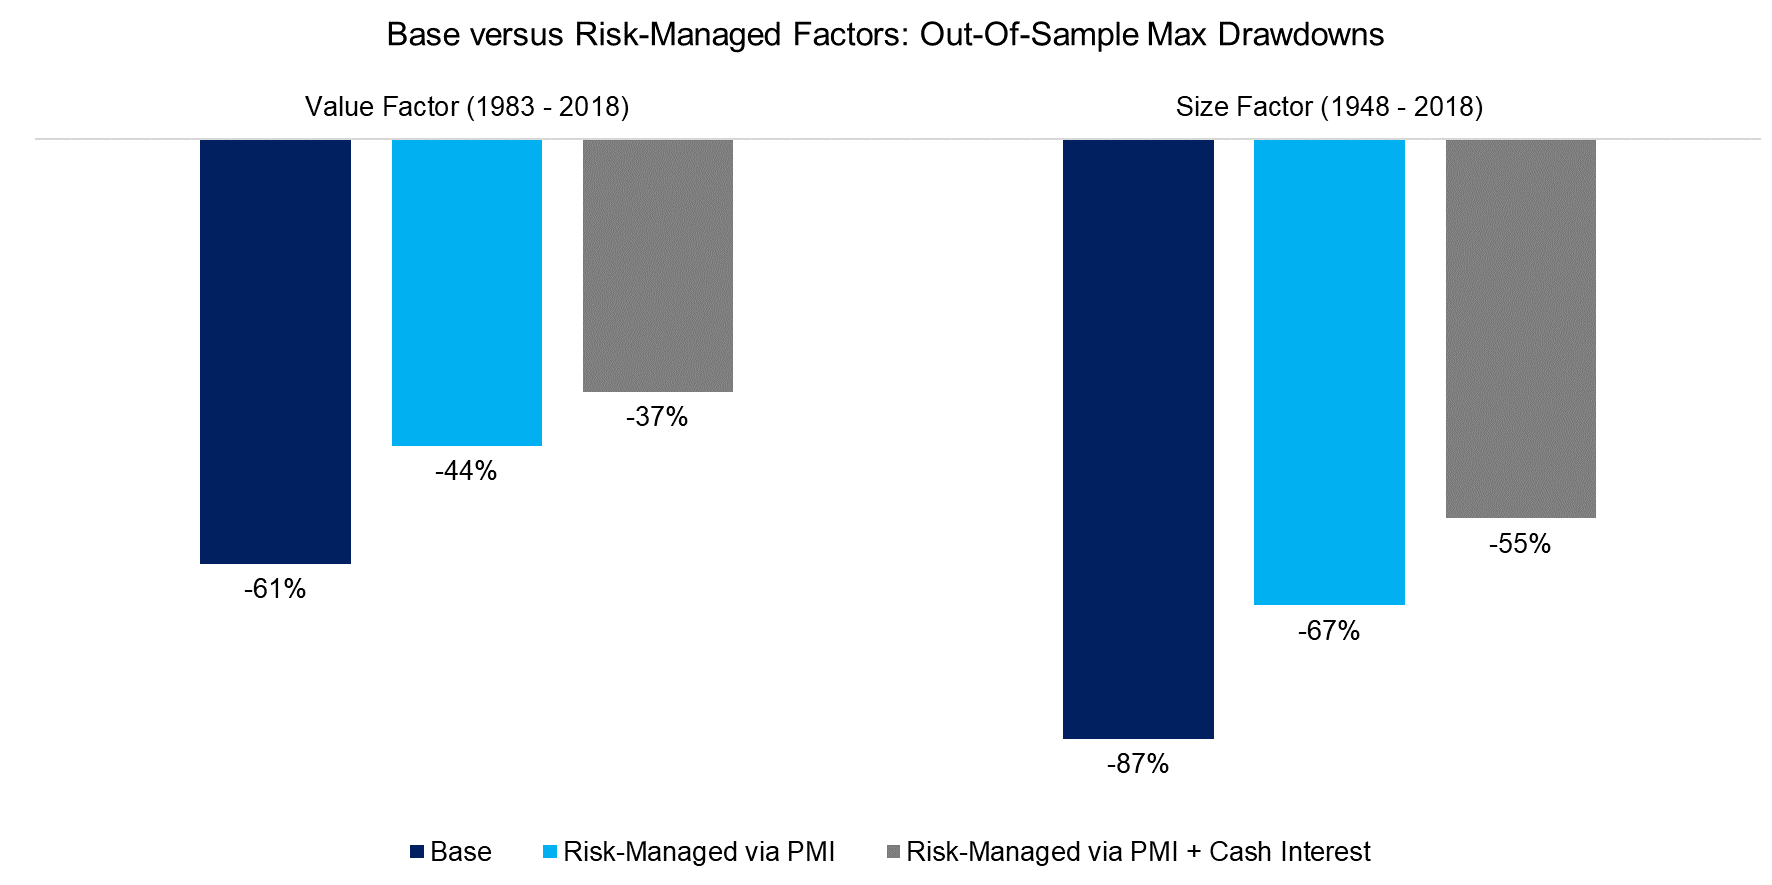
Investors should not focus on using variables like the PMI to time factors and aim to generate higher performance, but measure when factors might become more or less risky with a focus on reducing drawdowns. Approaches to forecasting risk tend to be more successful than forecasting returns, perhaps because risk exhibits auto-correlation and clusters.
We observe that avoiding periods where the PMI was trending very negatively would have reduced the maximum drawdowns of the Value and Size factors in the out-of-sample periods significantly.
Source: FactorResearch. The results are hypothetical results and are NOT an indicator of future results and do NOT represent returns that any investor actually attained. Indexes are unmanaged, do not reflect management or trading fees, and one cannot invest directly in an index.
FURTHER THOUGHTS
We do not advocate investors to allocate to factors based on single economic variables like the PMI, but simply want to highlight an interesting relationship that warrants further research. PMI and factor data is available for most markets, which provides a good data set for additional analysis.
Value and Size seem to be primarily driven by risk sentiment while the Momentum factor has different performance drivers, which reflects the unique nature of factors. Identifying these drivers is challenging, but empowers investors with knowledge and potentially offers better ways of harvesting factor returns.
About the Author: Nicolas Rabener
—
Important Disclosures
For informational and educational purposes only and should not be construed as specific investment, accounting, legal, or tax advice. Certain information is deemed to be reliable, but its accuracy and completeness cannot be guaranteed. Third party information may become outdated or otherwise superseded without notice. Neither the Securities and Exchange Commission (SEC) nor any other federal or state agency has approved, determined the accuracy, or confirmed the adequacy of this article.
The views and opinions expressed herein are those of the author and do not necessarily reflect the views of Alpha Architect, its affiliates or its employees. Our full disclosures are available here. Definitions of common statistics used in our analysis are available here (towards the bottom).
Join thousands of other readers and subscribe to our blog.