Cross-Sectional and Time-Series Tests of Return Predictability: What Is the Difference?
- Amit Goyal and Narasimhan Jegadeesh
- A version of this paper can be found here
- Want to read our summaries of academic finance papers? Check out our Academic Research Insight category
What are the research questions?
A point of confusion for many new quant momentum investors is the difference between Time- Series Momentum and Cross-Sectional Momentum:
- Time-series (TS) looks at each individual stock’s momentum and owns assets with positive momentum while shorting those with negative momentum;
- Cross-sectional (CS) observes a universe of stocks and chooses those with the best momentum relative to the universe it’s in, shorting those at the bottom.
To understand the difference, it’s best to use an example. For a universe of two stocks, Coke and Pepsi, over the same time period, Coke rises from $10 to $15 a share while Pepsi increases from $10 to $25. An investor using a Time-Series method would hold both Coke AND Pepsi, as they both have positive momentum for the period. A Cross-Sectional momentum investor would be long Pepsi (as it has better momentum) and would short Coke, as it has relatively poor momentum.(1) For a more thorough explanation, check out Larry Swedroe’s post: Time Series Momentum (aka Trend-Following): A Good Time for a Refresh.
Both the seminal TS paper (Moskowitz, Ooi, and Pedersen for a diverse set of asset classes) and more recent research (for example, D’Souza, Srichanachaichok, Wang, and Yao for individual U.S. and international stocks) find that TS subsumes CS but not vice versa.
Goyal and Jegadeesh decide to re-define CS in order to compare the TS and CS strategies as fairly as possible. Using individual U.S. stocks (1946-2013, excluding microcaps), they build CS momentum by buying (shorting) stocks with trailing returns higher (lower) than the cross-sectional average. The stocks are equal-weighted, and $1 is invested each month on both the long and the short sides. This ensures that CS uses all the stocks in the portfolio, just as TS does. However, CS is always dollar-neutral, while TS can take a net long (short) position if more stocks have had recent positive (negative) returns, a difference that our example above showed.
This difference, the degree to which TS is net long or short, is defined as the time-varying market exposure (TVM). It’s the dollar value of TS’s long side minus the dollar value of TS’s short side. The authors then combine CS and TVM to construct CSTVM, which goes net long or short the market to the same extent that TS is net long or short. CSTVM is therefore directly comparable to TS, with the only difference being that CSTVM obtains its net long or short exposure through the market, while TS does it by picking individual stocks.
They also run similar tests using 55 futures markets in equities, bonds, commodities, and currencies (1985 to 2013).
Now they’re in a position to address some important questions:
- What is the effect of time-series momentum’s net long or short positions?
- Does adjusting for cross-sectional momentum’s time-varying market exposure address CS’s weaknesses?
- If so, is it preferable to use CSTVM over TS?
What are the Academic Insights?
- MARKET TIMING AND MARKET RISK PREMIUM. For short (long) formation periods, most of TS’s time-varying market (TVM) returns come from market timing (being passively net long the market). For example, for one-month formation and holding periods in individual stocks, TVM’s market timing return is six times that of its return from passive market exposure, although both are statistically significant. For six-month formation and holding periods, the market timing return becomes negative (though not statistically significant). In other words, for long formation periods, time-series momentum has no market timing benefit and is outperforming CS momentum by picking up the underlying market’s risk premium. Results are similar for futures, although the market timing benefit there remains positive for formation periods of up to a year.
- YES. Adding a time-varying exposure to the market to CS makes it perform similarly to TS as long as the same methodology is used to size positions: if inverse volatility weighting is used for TS, it should be used for CS as well, especially when bonds are involved. Differences in alphas between CSTVM and TS are mostly statistically insignificant. This suggests that the benefit of TS is its ability to be net long or short the market rather than in its ability to identify specific assets within the market that will outperform.
- YES. A time-varying market exposure makes CS comparable to TS, but that overlay doesn’t have to be used in cases where an investor wants to trade short-term or long-term reversals, which CS is better suited for than TS. CSTVM may also work better than TS in bonds.
Why does it matter?
Replacing time-series momentum in individual stocks/futures contracts with cross-sectional momentum plus a time-varying exposure to the market may be easier to conceptualize and simpler to explain to others. The authors also present a general way to evaluate trend-following systems by decomposing their time-varying market exposures into passive market risk premium and active market timing components.
The most important chart from the paper
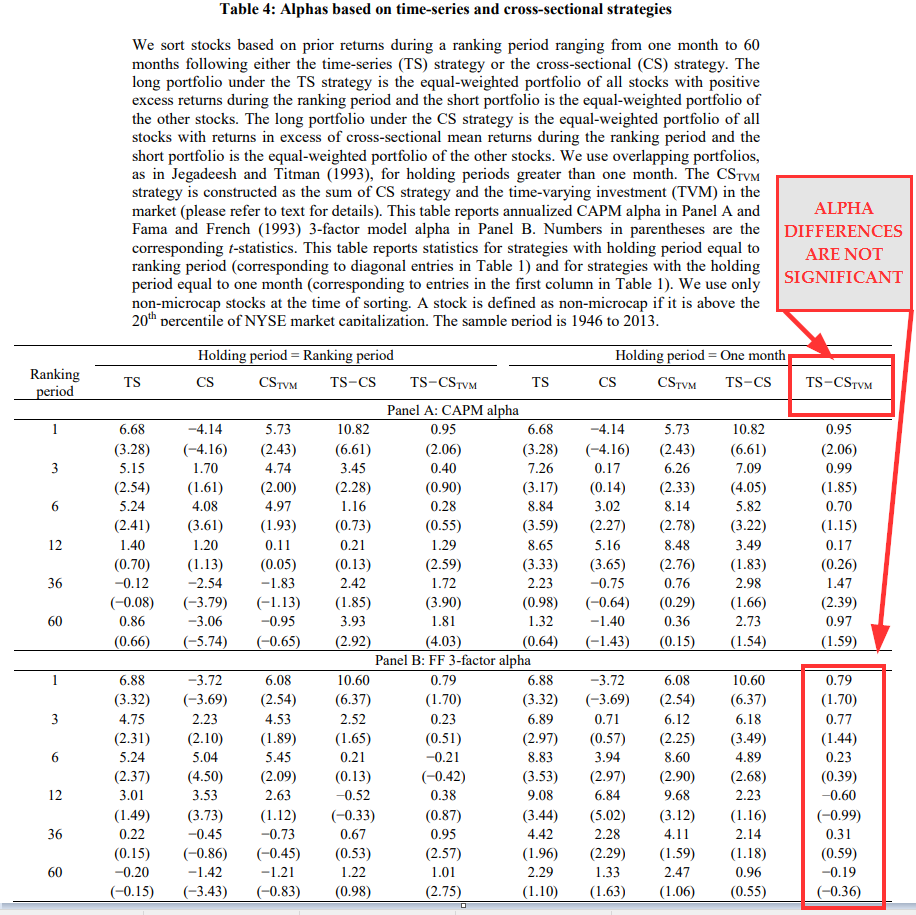
Source: Amit Goyal and Narasimhan Jegadeesh, Cross-Sectional and Time-Series Tests of Return Predictability: What is the Difference?* July 2017The results are hypothetical results and are NOT an indicator of future results and do NOT represent returns that any investor actually attained. Indexes are unmanaged and do not reflect management or trading fees, and one cannot invest directly in an index.
Abstract
We compare the performance of time-series (TS) and cross-sectional (CS) strategies based on past returns. While CS strategies are zero-net investment long/short strategies, TS strategies take on a time-varying net-long investment in risky assets. For individual stocks, the difference between the performances of TS and CS strategies is largely due to this time-varying net-long investment. With multiple international asset classes with heterogeneous return distributions, scaled CS strategies significantly outperform similarly scaled TS strategies.
References[+]
| ↑1 | This example is paraphrased from Wes and Jack’s excellent book Quantitative Momentum. |
|---|
About the Author: Darren Hom
—
Important Disclosures
For informational and educational purposes only and should not be construed as specific investment, accounting, legal, or tax advice. Certain information is deemed to be reliable, but its accuracy and completeness cannot be guaranteed. Third party information may become outdated or otherwise superseded without notice. Neither the Securities and Exchange Commission (SEC) nor any other federal or state agency has approved, determined the accuracy, or confirmed the adequacy of this article.
The views and opinions expressed herein are those of the author and do not necessarily reflect the views of Alpha Architect, its affiliates or its employees. Our full disclosures are available here. Definitions of common statistics used in our analysis are available here (towards the bottom).
Join thousands of other readers and subscribe to our blog.