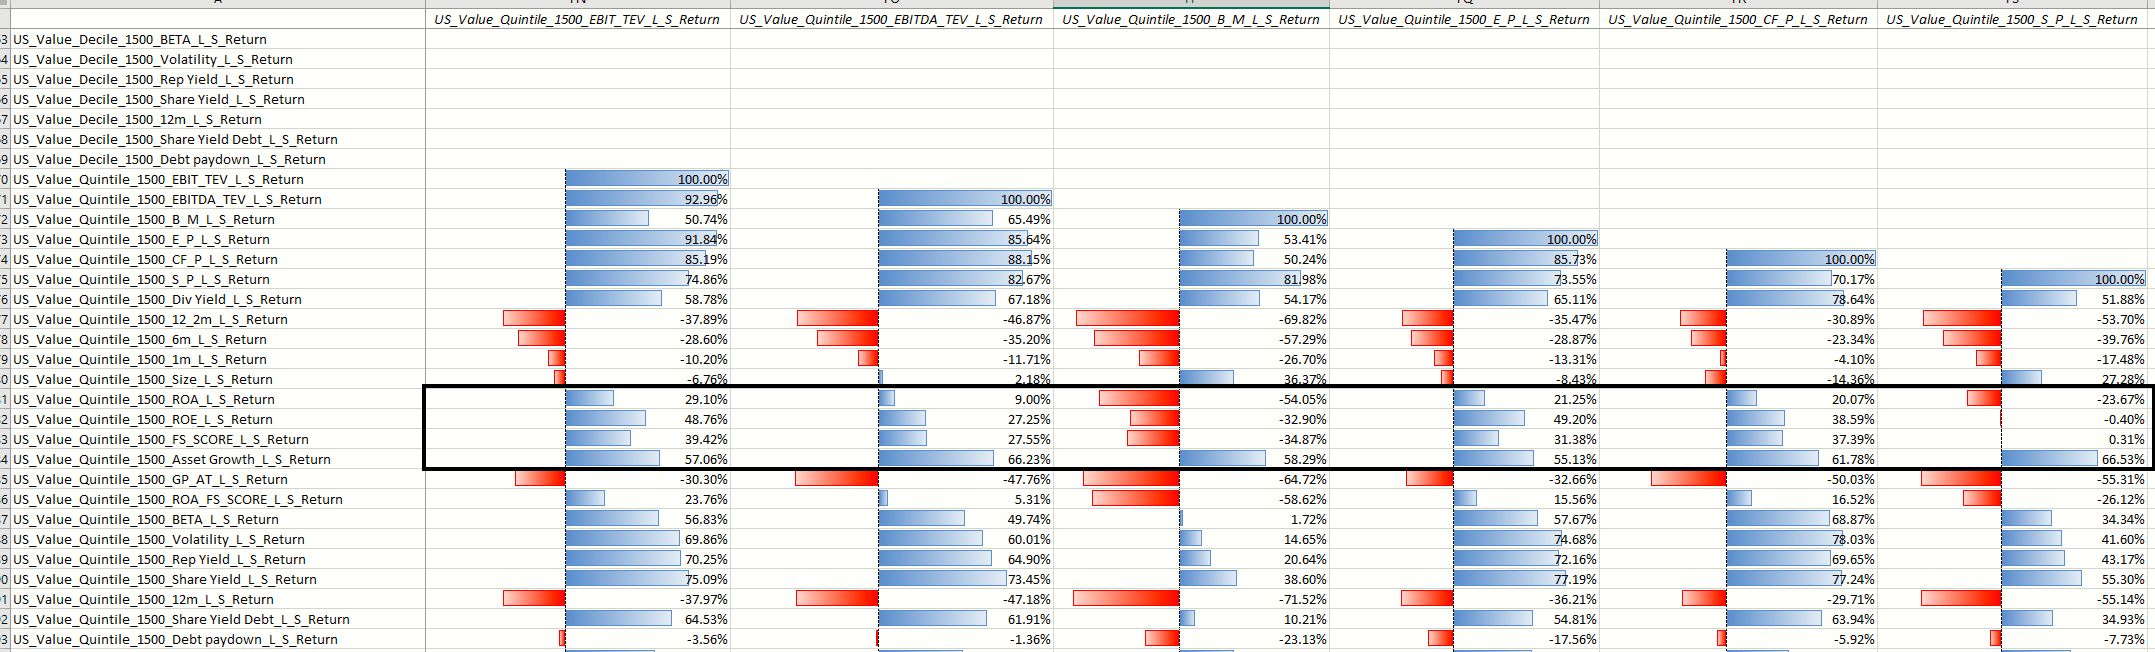
We recently added a monster correlation matrix to our factor library data sheet that maps out the correlation of all the factors against every other factor.
Here is a sample output that highlights the difference in the correlations between value factors and different quality factors. Note the big difference between book to market, which has a negative correlation to quality, and the other metrics — ebit/tev, ebitda/tev, earnings/price, and cash flow/price — which have a positive correlation. A simple implication is that if you run a systematic value strategy that leans on book to market, adding a quality component may improve your expected outcomes.
The results are hypothetical results and are NOT an indicator of future results and do NOT represent returns that any investor actually attained. Indexes are unmanaged and do not reflect management or trading fees, and one cannot invest directly in an index.
Our biga$$ factor library, with almost every Long/Short factor imaginable for the US, International Developed, and Canadian Markets, is available for hazing (announcement here).
You can download here (on Factors download): https://alphaarchitect.com/indexes/#returndownload
We are building interactive tools via R so the data is easier to “see”, but in the short run, you can hack around on our spreadsheet (click on the factors download via the link above).
Please share any insights you might have from perusing the data.
About the Author: Wesley Gray, PhD
—
Important Disclosures
For informational and educational purposes only and should not be construed as specific investment, accounting, legal, or tax advice. Certain information is deemed to be reliable, but its accuracy and completeness cannot be guaranteed. Third party information may become outdated or otherwise superseded without notice. Neither the Securities and Exchange Commission (SEC) nor any other federal or state agency has approved, determined the accuracy, or confirmed the adequacy of this article.
The views and opinions expressed herein are those of the author and do not necessarily reflect the views of Alpha Architect, its affiliates or its employees. Our full disclosures are available here. Definitions of common statistics used in our analysis are available here (towards the bottom).
Join thousands of other readers and subscribe to our blog.