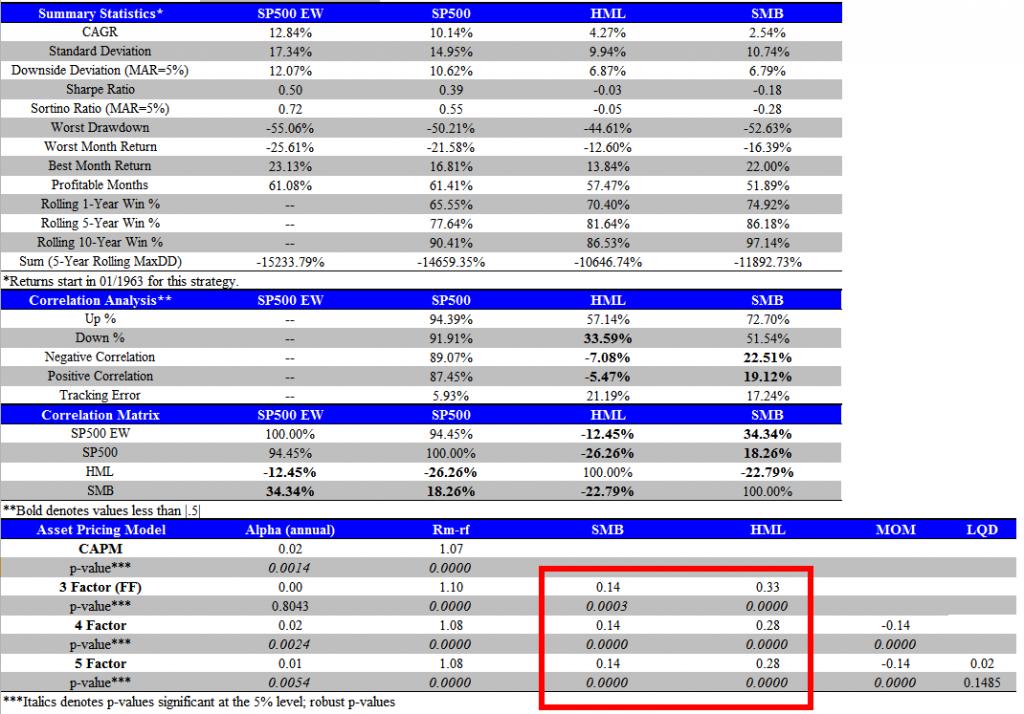
First, a detailed analysis of the S&P 500 equal-weight index against the S&P 500 value-weight index from Jan 1963 through September 2013:
- The equal-weight S&P 500 generates 270bps over the value-weight index.
- HML, the size-adjusted “value factor”, generates a nice CAGR spread of 4.27%. (http://mba.tuck.dartmouth.edu/pages/faculty/ken.french/Data_Library/f-f_factors.html)
- SML, the value-adjusted “value factor”, generates a nice CAGR spread of 2.54% (http://mba.tuck.dartmouth.edu/pages/faculty/ken.french/Data_Library/f-f_factors.html)
What drives the spread?

The results are hypothetical results and are NOT an indicator of future results and do NOT represent returns that any investor actually attained. Indexes are unmanaged, do not reflect management or trading fees, and one cannot invest directly in an index. Additional information regarding the construction of these results is available upon request.
Many people assume the spread between EW and VW is a size premium, but this doesn’t tell the entire story.
Review the Asset Pricing Model module above (key stats highlighted).
This analysis represents the beta estimates for a variety of asset pricing models, which are used to control for different exposures on a portfolio. Rm-rf is the market-risk free spread; SMB is a L/S spread that captures small-stock exposure; HML is a L/S spread that captures value-stock exposure; and MOM is a L/S spread that captures momentum exposure.
Here is an explanation of how to calculate the various beta/alphas:
http://youtu.be/mrfWCUKX1Qw
The S&P 500 EW index has a fairly large exposure to the “value factor,” which suggests that the spread is driven by size, but also value! There is also a beta of 1.1, suggesting a slightly higher beta.
Below we look at the same analysis, but for the S&P 500 index. There is a beta of 1 (makes sense), a negative size factor (i.e., the value-weight index tilts large), and a roughly flat value exposure.

The results are hypothetical results and are NOT an indicator of future results and do NOT represent returns that any investor actually attained. Indexes are unmanaged, do not reflect management or trading fees, and one cannot invest directly in an index. Additional information regarding the construction of these results is available upon request.
On net, there is an approximate .32 point increase in the SMB beta and a .31 point increase in the HML beta between EW and VW S&P 500. A casual interpretation of these results is that the premium for the EW S&P 500 index is partially driven by a size premium, but also driven by a value premium.
About the Author: Wesley Gray, PhD
—
Important Disclosures
For informational and educational purposes only and should not be construed as specific investment, accounting, legal, or tax advice. Certain information is deemed to be reliable, but its accuracy and completeness cannot be guaranteed. Third party information may become outdated or otherwise superseded without notice. Neither the Securities and Exchange Commission (SEC) nor any other federal or state agency has approved, determined the accuracy, or confirmed the adequacy of this article.
The views and opinions expressed herein are those of the author and do not necessarily reflect the views of Alpha Architect, its affiliates or its employees. Our full disclosures are available here. Definitions of common statistics used in our analysis are available here (towards the bottom).
Join thousands of other readers and subscribe to our blog.

