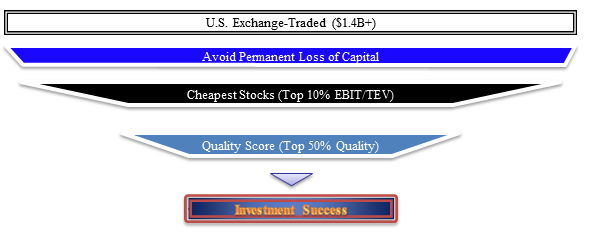
This post is the first in a series that will discuss Turnkey Analyst’s approach to finding the holy grail of quantitative finance – a robust, reliable method of identifying low risk, high quality, undervalued stocks that generate market beating returns.
The Turnkey PhD–along with http://greenbackd.com/–are publishing a book via Wiley that will discuss the holy grail of quantitative value systems (not available until December). However, since we know that blog readers are hungry for details today, we wanted to lay out some of the concepts.
Avoid Permanent Loss of Capital
We turn to one of our favorite value investors for insight into the first premise of our approach:
Loss avoidance must be the cornerstone of your investment philosophy.
– Seth Klarman
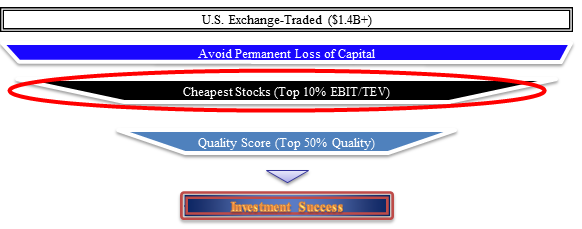
Below we highlight the stage of the quantitative value process where Klarman’s concept comes into play
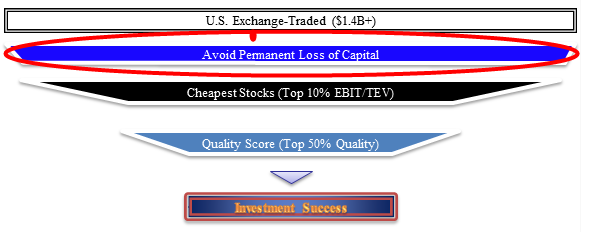
As Mr. Klarman might advise, as a first criterion for making a successful investment, one might eliminate from the set of firms under consideration those that risk causing permanent impairment of capital.
Financial losses can come in many forms, but we can reduce the risks that can be useful in predicting them to three basic categories:
- financial statement manipulation
- fraud
- financial distress or bankruptcy
There can be significant overlap among these areas, and they can affect each other in many ways. For instance, financial statement manipulation might be a precursor to outright fraud, or financial distress might drive managers to manipulate the financials. We are not particularly interested in understanding which problem affected the company first; we simply want to know which firms are infected with the capital destruction disease.
How can we predict which firms will manipulate earnings or commit fraud?
Earnings manipulation often accompanies financial losses, and so we begin our quest to eliminate risky firms from our investment consideration process by applying three basic statistical tools, culled from rigorous studies in academia, that can help us identify when managers are manipulating earnings. The first two of these tools relate to accruals, and the accrual anomaly. For a primer on the accrual anomaly, please see our post HERE from last year.
Our accruals tools measure 1) the flow of accruals (how aggressively were accruals used in the last year), and 2) the stock of accruals (to what degree have accruals accumulated on the balance sheet over time).
We can determine the flow of accruals by asking a simple question: does net income exceed cash flow? If it does, we know the company is using accruals. Next, we scale these accruals versus the company’s assets: Net income – cash flow from operations / total assets. When applying this formula, Scaled Total Assets (STA), if the ratio of accruals versus assets is very high, it is a statistical red flag, and we won’t invest in the company.
We measure the stock of accruals by examining the difference between operating assets (total assets – cash) and operating liabilities (total assets – debt – book equity). Once again, we scale these by assets: Operating assets – operating liabilities / total assets. This is known the Scaled Net Operating Assets (SNOA) model, and if firms show very high cumulative accruals on the balance sheet, once again we won’t invest in the company.
Another method for identifying earnings manipulators and fraudulent financial reporting is the Probability of Manipulation (PROBM) model, which is made up a blend of financial statistics that have over time successfully predicted instances of financial statement manipulation and fraud. These include such metrics as increases in outstanding receivables, which can indicate improper revenue recognition, and decreases in depreciation rates, which can indicate an attempt to inflate earnings. PROBM is another powerful tool that can identify companies that are statistically likely to be engaged in fraud and manipulation. As with the STA, and SNOA models, if PROBM signals a high degree of risk, then we won’t invest in the company.
Here are the sources on the measures we employ:
- Beneish (1999): The Detection of Earnings Manipulation
- Sloan (1996): Do Stock Prices Fully Reflect Information in Accruals and Cash Flows About Future Earnings?
- Hirshleifer et al. (2004): Do Investors Overvalue Firms with Bloated Balance Sheets?
Who will end up bankrupt or financially distressed?
Another risk that we seek to minimize is that of financial distress, or outright bankruptcy. Once again, we turn to academia for a tool that can assist in this critical task. In measuring the risk of financial distress, we employ a statistical technique called “logistic regression,” which is a type of regression analysis used when trying to predict a binary outcome. As with our previous models, there are several inputs, which employ accounting-based and equity market metrics. For example, a larger market capitalization, or a larger cash position would tend to decrease the risk of subsequent bankruptcy.
Conversely, higher leverage, higher volatility and lower profitability are predictive of future financial distress. Finally, the output from the regression is reduced to a single measure, the probability of financial distress, or PFD, which ranges from 0 to 100%. As with our earning manipulation and fraud detection tools above, if our model is showing heightened risk of bankruptcy for a company, then we won’t invest.
Here is a post on the subject: https://alphaarchitect.com/2011/07/stop-using-altman-z-score/
Here is some background research:
- Campbell, Hilscher, and Szilagyi (2008): In Search of Distress Risk (Discussion Piece that is more “Barney Style”)
- Campbell, Hilscher, and Szilagyi (2010): Predicting Financial Distress and the Performance of Distressed Stocks (similar to above but with data out to 2008, see Table 2 and compare to Table IV in older version)
The Results?
We believe we have identified several powerful statistical tools that can inoculate investors against many of the risks associated with permanent loss of capital. By employing the STA, SNOA and PROBM models, which predict earnings manipulation and fraud, and PFD, which predicts financial distress and bankruptcy, we can eliminate from consideration those firms that would pose a high degree of risk to our portfolio.
We show how screening out the garbage can minimize left-tail events via this blogpost: https://alphaarchitect.com/2012/05/does-screening-out-garbage-enhance-performance/
Now that we have “cleaned” our universe of potential stocks to invest in, we will review in Part 2 of this series of posts how to identify high quality firms with sustainable competitive advantages, the so-called “economic moat” popularized by Warren Buffett.
About the Author: David Foulke
—
Important Disclosures
For informational and educational purposes only and should not be construed as specific investment, accounting, legal, or tax advice. Certain information is deemed to be reliable, but its accuracy and completeness cannot be guaranteed. Third party information may become outdated or otherwise superseded without notice. Neither the Securities and Exchange Commission (SEC) nor any other federal or state agency has approved, determined the accuracy, or confirmed the adequacy of this article.
The views and opinions expressed herein are those of the author and do not necessarily reflect the views of Alpha Architect, its affiliates or its employees. Our full disclosures are available here. Definitions of common statistics used in our analysis are available here (towards the bottom).
Join thousands of other readers and subscribe to our blog.