Inflation Risk and the Cross Section of Stock Returns
- Fernando M. Duarte
- A version of the paper can be found here.
- Want a summary of academic papers with alpha? Check out our free Academic Alpha Database!
Abstract:
I establish that inflation risk is priced in the cross section of stock returns: Stocks that have low returns during inflationary times command a risk premium. I estimate a market price of inflation risk that is comparable in magnitude to the price of risk for the aggregate market. Inflation is therefore a key determinant of risk in the cross section of stocks. The inflation premium cannot be explained by either the Fama-French factors or industry effects. Instead, I argue the premium arises because high inflation lowers expectations of future real consumption growth. To formalize and test this hypothesis, I develop a consumption-based general equilibrium model. The model generates a price of inflation risk consistent with my empirical estimates, while simultaneously matching the joint dynamics of consumption and inflation, the aggregate equity premium, and the level and slope of the yield curve. My model suggests that the costs of inflation are significant: A representative agent would be willing to give up 1.5 percent of lifetime consumption to eliminate all inflation risk.
Data Sources:
CPI, PCE, CRSP, IMF, Fama-Bliss Bond files, Cochrane-Piazzesi factor
Alpha Highlight:
Table 3 suggests annual 4-factor alpha (average of absolute value of alpha from 10 decile portfolios) of 2.80%
The results are hypothetical results and are NOT an indicator of future results and do NOT represent returns that any investor actually attained. Indexes are unmanaged, do not reflect management or trading fees, and one cannot invest directly in an index. Additional information regarding the construction of these results is available upon request.
Strategy Summary:
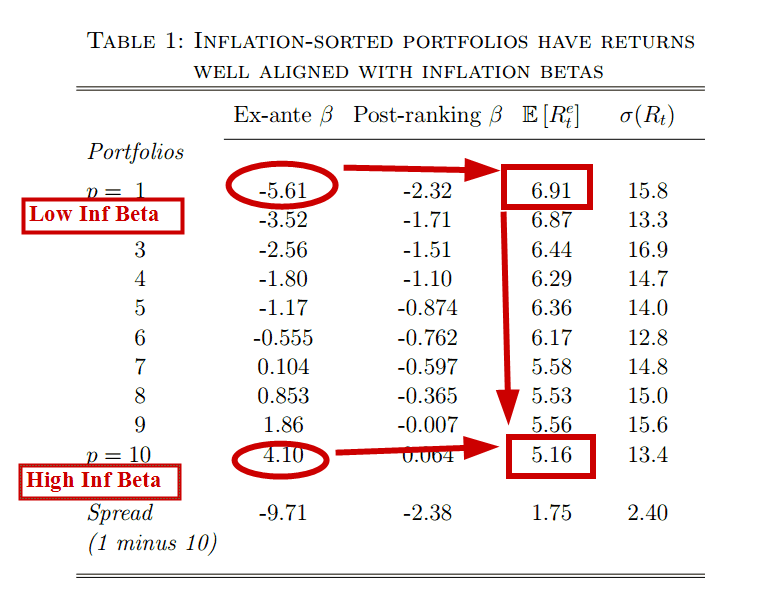
- Regress each stock against inflation innovations (as described on pages 7-9) to get each firm’s inflation beta.
- Form decile portfolios based on each firm’s inflation beta.
- Lowest inflation decile earns a mean return of 6.91% per year, compared to a 5.16% mean return for the highest inflation decile (Table 1).
- Deciles have similar characteristics (size, book-to-market, momentum, and industry concentration as shown in Table 2), so the higher return on lower inflation beta deciles cannot be explained by common risk factors.
Commentary:
- Table 3 shows the mean absolute-value alpha of the 10 portfolios (ie take the absolute value of the 10 decile alphas, then take the mean of these 10 numbers), but it would be nice to see the alphas for each decile.
Is low inflation beta a a proxy for the low-beta anomaly?
About the Author: Wesley Gray, PhD
—
Important Disclosures
For informational and educational purposes only and should not be construed as specific investment, accounting, legal, or tax advice. Certain information is deemed to be reliable, but its accuracy and completeness cannot be guaranteed. Third party information may become outdated or otherwise superseded without notice. Neither the Securities and Exchange Commission (SEC) nor any other federal or state agency has approved, determined the accuracy, or confirmed the adequacy of this article.
The views and opinions expressed herein are those of the author and do not necessarily reflect the views of Alpha Architect, its affiliates or its employees. Our full disclosures are available here. Definitions of common statistics used in our analysis are available here (towards the bottom).
Join thousands of other readers and subscribe to our blog.