It always pays to focus on what you can get for free, but this is especially true for investing. In this Part 2 of our “Focus on What You Can Get for Free” series, we explore some tools for assessing the dual roles of skill and luck in portfolio management, within the context of what you can get for free. After all, you shouldn’t have to pay for either something that resembles skill, or for luck, when either may really be merely a result of portfolio attributes or construction.
In Part 1 of our series (which can be found here: https://alphaarchitect.com/2013/11/01/focus-on-what-you-can-get-for-free-part-12/), we discussed how size and value factors in a portfolio can lead one to wrongly conclude a portfolio is outperforming, when in reality it may be underperforming relative to an appropriate benchmark. There are several additional factors to consider when setting this benchmark, but they are beyond the scope of the current discussion. The good news is that, as with size and value factors, you can also get these other factors for free (or for low-cost)!
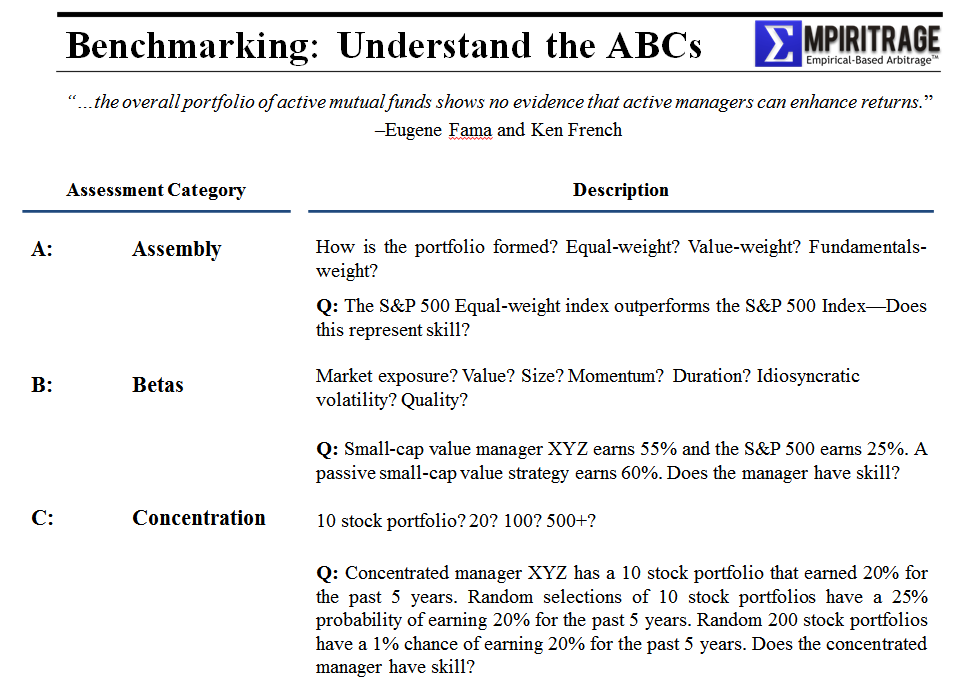
Consider our A-B-C framework for understanding Performance Assessment
Source: Empiritrage, LLC
A: Assembly
Consider weightings within a portfolio. It’s a well-known phenomenon that an equal-weighted portfolio will, in the long run, outperform one using value weights. A value weighted index, such as the S&P 500, whose weights are determined by market capitalization will, by definition, overweight large cap stocks, and underweight small cap stocks, which sets up this index for underperformance. The size effect is an important driver here. Wes recently highlighted that the equal-weight effect is not simply a size effect–it may also be a closet value strategy: https://alphaarchitect.com/2013/11/14/what-drives-the-sp-500-equal-weight-premium-size-and-value/
There has been some recent debate about the size effect, in particular, around the idea that the effect disappeared after the early 1980s.
In their paper, “Resurrecting the Size Effect: Firm Size, Profitability Shocks, and Expected Stock Returns” (a copy of which can be found here: (http://finance.rice.edu/seminar/abstracts/hou_100608.pdf), Hou, and Van Dijk argue persuasively that, during the sample period (after the early 80s) many cite as marking the “death” of the size effect, negative profitability shocks occurred at small firms (many of which were newly listed) and positive shocks occurred at big firms (which benefited from industry market structure changes), causing the size premium to disappear. It may be that over time these asymmetric profitability shocks, which benefited large caps and hurt small caps, will continue, and if you believe that, then perhaps equal weighting portfolios doesn’t make sense for you.
If you do, however, believe in the benefits of equal weighting, and you are invested with an asset manager who constructs portfolios with equal weights, or another weighting regime, then when assessing performance, you should control for this variable. In general, you should compare performance against a benchmark reflecting a universe with the same weights the manager employs. The point is, if a manager appears to be outperforming based on supposed “skill,” this performance may simply be a result of portfolio construction and weighting, which you can get for free.
B: Betas
We have discussed how to think critically about your exposure to certain factors (size, value, weighting), but there many other exposures that can be relevant. For example, you might consider fundamental factors such as dividends, cash flow, earnings quality, or profitability. Other, more esoteric factors might be based on liquidity, momentum or volatility. Each of these factors may offer a premium versus the broader indexes.
Multiple regression techniques can help tease out these exposures, by identifying combinations of predictive variables that may exist in a portfolio, and controlling for them. This has been described in the press as “smart beta.” As with the simpler factors discussed earlier, you should not have to pay much for these exposures, since you also can hire systematic managers to build these exposures at reasonable costs.
Wes discusses some data one can access to benchmark different return premia associated with size/value/momentum benchmark portfolios: https://alphaarchitect.com/2013/09/24/identify-your-size-value-and-momentum-benchmark/
C: Concentration
A final area worth thinking about is concentration, which relates to the degree of diversification in a portfolio.
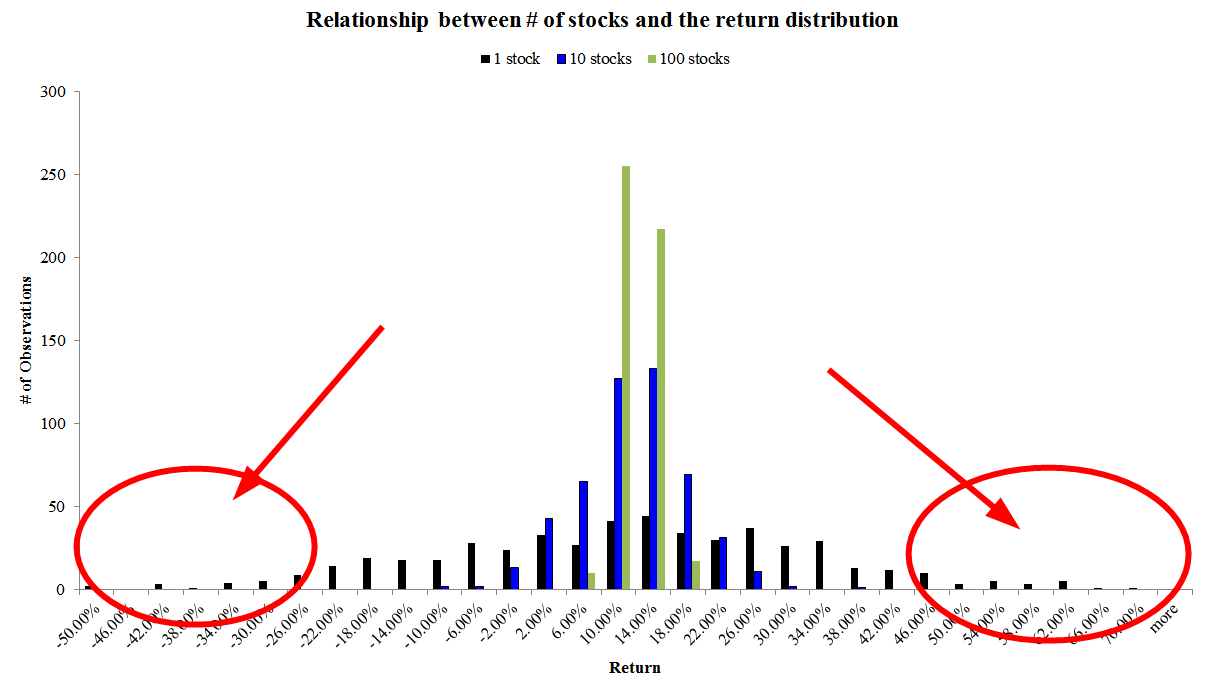
Compare the potential return distributions of a 5 stock portfolio to those for a 500 stock portfolio. Within a 5 stock portfolio, the possibility that one or more stocks could go bankrupt, or shoot up 1,000% means the range of outcomes for the portfolio is very wide, and the distribution of potential outcomes has very fat tails, when compared to that for the 500 stock portfolio.
With this in mind, it’s apparent that if a very concentrated portfolio has a very good (or bad) performance outcome (say, a 3 sigma departure from the index), there’s a reasonable chance that outcome was entirely attributable to luck. A small oil & gas firm hit a bonanza well. Food poisoning brought down a levered supermarket chain. By contrast, if you see similarly extreme performance event with respect to a fund that holds 500 stocks, it is much, much less likely that the outperformance was due to luck.
In sum, we would argue that when assessing whether to invest with a manager, you should know what exposures you are buying, and then control for the different aspects that drive returns. If the manager is effectively buying small cap and momentum exposure, and yet merely matches the performance of a factor-based strategy that can give you the same exposure at very low cost, well then you should think twice about a large management or performance fee.
Here is a spreadsheet and accompanying chart to help you better understand concentration risk and how it affects returns:
- diversification Spreadsheet
The sheet essentially pools together portfolios of idiosyncratic bets with a mean of10% and a standard deviation of 20%. The chart below highlights how concentration increases the tail observations.
Conclusion:
In the end, the rules are simple:
- Focus on the ABCs of benchmarking.
- Never pay expensive fees for what can you get at a low cost.
- Haze your managers and ensure they understand how and why you assess their performance relative to an ABC-driven benchmark.
- Fire managers that can’t produce and/or can’t understand proper benchmarking.
About the Author: David Foulke
—
Important Disclosures
For informational and educational purposes only and should not be construed as specific investment, accounting, legal, or tax advice. Certain information is deemed to be reliable, but its accuracy and completeness cannot be guaranteed. Third party information may become outdated or otherwise superseded without notice. Neither the Securities and Exchange Commission (SEC) nor any other federal or state agency has approved, determined the accuracy, or confirmed the adequacy of this article.
The views and opinions expressed herein are those of the author and do not necessarily reflect the views of Alpha Architect, its affiliates or its employees. Our full disclosures are available here. Definitions of common statistics used in our analysis are available here (towards the bottom).
Join thousands of other readers and subscribe to our blog.